


Learn how forex chart patterns work, including double tops and bottoms, head and shoulders, flags, pennants, triangles, rectangles, and wedges. Discover how to identify, confirm, trade, and test these patterns while managing risk, avoiding false breakouts, and accounting for real market conditions.
Forex chart patterns are recurring price structures that traders use to organize possible continuation, reversal and breakout scenarios. They develop as price swings interact with support, resistance, trendlines and periods of consolidation. Common forex chart patterns include double tops and bottoms, head and shoulders, flags, pennants, triangles, rectangles and wedges.
A useful pattern can help answer three practical questions: what must happen for a trade idea to become active, where that idea becomes invalid, and how a possible price objective might be estimated.
The same formation can resolve differently depending on the prior trend, volatility, liquidity, nearby higher-timeframe levels and the quality of the breakout. The useful question is therefore not simply, “What pattern is this?” but, “What structure does it represent, what would confirm it, and what would prove the idea wrong?”
This guide explains the main forex chart patterns, the differences between commonly confused formations, how to judge pattern quality, how entries and measured moves are commonly planned, why breakouts fail, and how to test pattern rules without relying on hindsight. The emphasis is on treating patterns as conditional market structures rather than predictive pictures.
Key Takeaways
- Forex chart patterns are most useful when interpreted in market context rather than treated as standalone signals.
- A recognizable shape is not necessarily a completed pattern. Confirmation rules should be defined before a setup is considered active.
- Continuation, reversal and bilateral classifications are useful, but prior trend and location can change how the same structure should be interpreted.
- Invalidation should be defined before the target. If the trader cannot explain what would make the pattern idea wrong, risk cannot be planned properly.
- Measured moves are projections, not guaranteed destinations. Nearby structure, spread, slippage and entry distance can materially change the trade.
- Pattern performance should be tested on the actual currency pair, timeframe and execution conditions instead of relying on generic accuracy claims.
What Are Forex Chart Patterns?
A forex chart pattern is a recognizable arrangement of price swings that develops over multiple bars or candles. The structure may contain repeated tests of support or resistance, converging trendlines, a controlled pullback after a strong move, or a sequence of progressively higher or lower swing points.
Patterns are often interpreted as expressions of changing buying and selling pressure. A double top shows two failed attempts to sustain trade above a similar price area. A triangle shows price compressing as the range between buyers and sellers narrows. A flag shows a directional move followed by a smaller countertrend or sideways pause.
Movement can accelerate when price crosses a widely observed area because orders may be clustered around obvious highs, lows, breakout levels or stop zones. That does not mean every breakout is driven by the same participants or that an obvious level must produce a large move. It simply helps explain why certain boundaries can become operationally important once price reaches them.
Market-psychology explanations should still be used carefully. A chart records transactions and price movement; it does not reveal the motives of every participant. Psychology is most useful when it helps explain structure: where price repeatedly failed, where swings are contracting or expanding, and what boundary must break before the market has actually changed state.
Chart Patterns vs. Candlestick Patterns
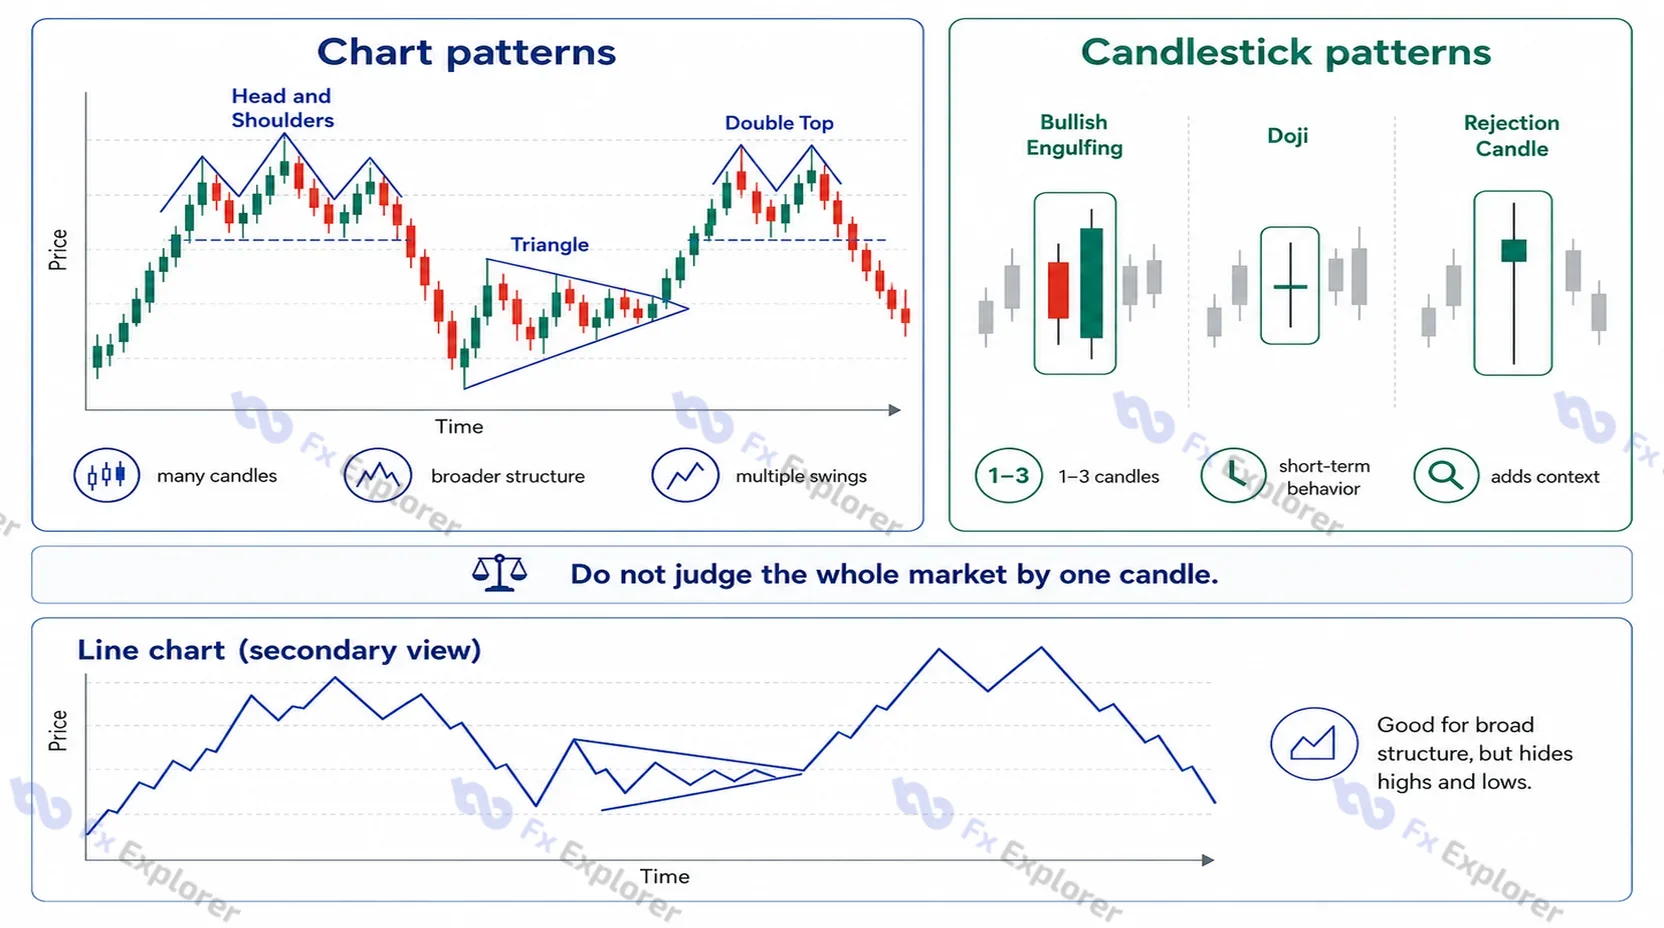
Chart patterns and candlestick patterns are both forms of technical analysis, but they describe different scales of price behavior.
A classical chart pattern normally develops across a sequence of swings and may take dozens or hundreds of candles to form. Head and shoulders, triangles, flags, rectangles and double tops are examples. Their interpretation depends on broader structure and the relationship between multiple highs and lows.
Candlestick patterns focus on one candle or a small group of candles, such as an engulfing formation, doji or rejection candle. They describe shorter-horizon behavior inside a larger structure. A bearish rejection candle near the second peak of a double top may add context, but the candle itself is not the double-top pattern.
Keeping the distinction clear prevents a common beginner mistake: assigning too much significance to one candle while ignoring the surrounding structure.
A line chart can sometimes make broader swing structure easier to see because it removes much of the intraperiod detail and emphasizes closing prices. It can be useful as a secondary view when checking whether a large pattern is genuinely visible or being forced from candle noise. However, line charts hide intraperiod highs and lows, so candlestick or bar data remain important when boundaries, breakout behavior or invalidation depend on those extremes.
Types of Forex Chart Patterns: Continuation, Reversal and Bilateral
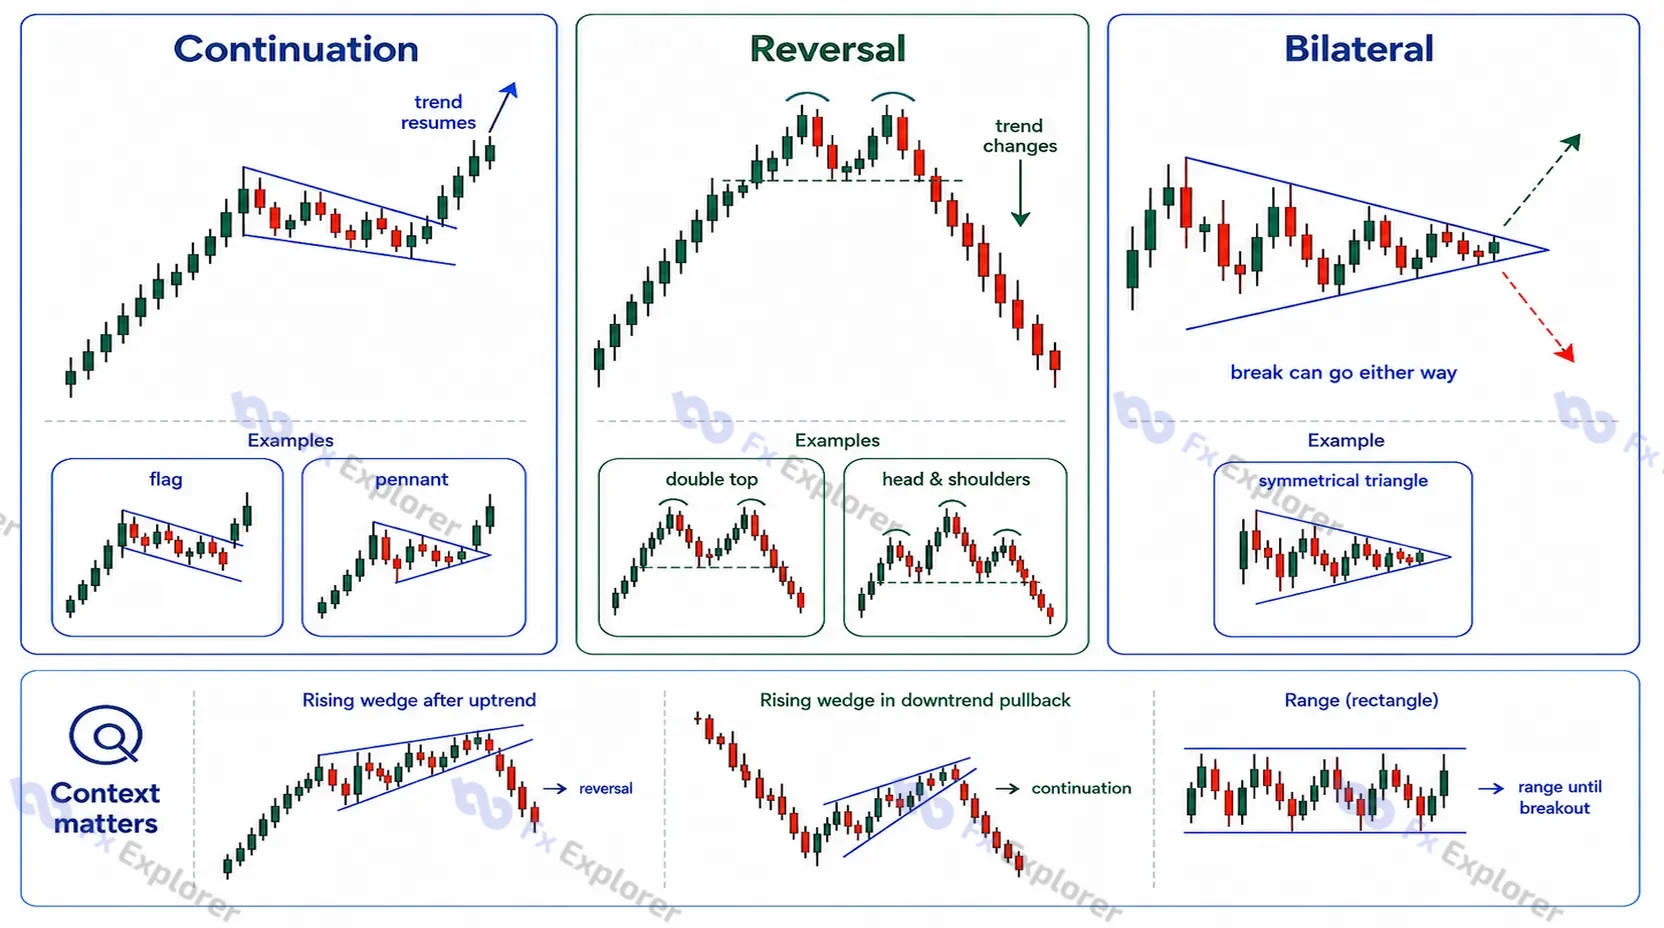
Forex chart patterns are commonly grouped into three broad categories.
Continuation patterns suggest that an existing trend may resume after a pause. Flags, pennants and some rectangles are common examples.
Reversal patterns suggest that the existing directional structure may be weakening or changing. Double tops, double bottoms, head and shoulders and rounded reversals fall into this group.
Bilateral or neutral patterns leave direction unresolved until price breaks the structure. A symmetrical triangle is the clearest example because price remains compressed between converging boundaries and can resolve either way.
These classifications are guides rather than fixed rules. A rising wedge near the end of an uptrend may act as a bearish reversal, while the same shape inside a larger downtrend may act as a bearish continuation pattern. A rectangle forming after an advance may eventually break upward, but while price remains inside the range, the rectangle itself is still two-sided.
How to Read a Forex Chart Pattern Before Trading It
The pattern name matters less than the quality of the structure and the conditions around it. Before considering an entry, the trader should understand what came before the pattern, why its boundaries matter, what would complete it and what would invalidate the idea.
Start With the Prior Market Structure
A reversal pattern needs something meaningful to reverse.
A head-and-shoulders formation after a sustained advance has a different interpretation from three random peaks inside a sideways market. A bull flag after a strong impulse has a clearer continuation context than the same small channel appearing inside a directionless range.
Start by identifying whether the market is trending upward, trending downward, ranging or transitioning between regimes. Higher highs and higher lows generally describe an uptrend. Lower highs and lower lows generally describe a downtrend. A range forms when price repeatedly rotates between upper and lower areas without sustaining directional progress.
The prior structure does not tell you what will happen next. It tells you whether the pattern label makes sense.
Check Whether the Pattern Is Clean Enough
Real charts rarely match textbook diagrams perfectly. A usable pattern does not need ideal symmetry, but its important swing points should be clear enough that the boundaries are not being invented after the fact.
Useful quality checks include:
- Are the trendlines connecting meaningful pivots?
- Has support or resistance been tested more than once?
- Has the structure had enough time to develop?
- Are the proportions reasonably coherent?
- Does the interpretation remain broadly intact as new candles appear?
- Is there a clear confirmation level and invalidation point?
A pattern becomes less useful when trendlines cut through large portions of price, swing points are selected only because they support a desired conclusion, or several contradictory interpretations fit the same area equally well.
Pattern quality matters more than finding a name for every fluctuation.
Forming Pattern vs. Completed Pattern
One of the most important distinctions in chart-pattern trading is the difference between a recognizable shape and a completed setup.
Two similar highs may suggest a potential double top, but the reversal is not structurally confirmed until price breaks the intervening swing low according to the trader's chosen rule. Three peaks may resemble head and shoulders, but the pattern remains incomplete while the neckline holds. A triangle is still unresolved while price remains inside its boundaries.
This distinction helps prevent entries based only on the expectation that a familiar formation is developing. Anticipating a pattern is not automatically wrong, but it is a different strategy from trading confirmed patterns and should be tested separately.
Confirmation and Breakout Rules
There is no single confirmation method that suits every strategy. The important requirement is that the rule is defined in advance and applied consistently.
A trader may act once price trades beyond the boundary, require a candle to close outside the structure, or wait for a breakout followed by a retest.
An early breakout entry can provide a better price but greater exposure to temporary breaches. Waiting for a close filters some intrabar noise but can result in a later entry and greater distance from invalidation. A retest can create clearer structure, but many valid breakouts never retest and the opportunity may be missed.
Former resistance can sometimes act as support after an upside breakout, while former support can become resistance after a downside break. That role reversal is useful when it occurs, but it should not be assumed.
A breakout does not need to retest to be valid, and a retest does not guarantee continuation.
Invalidation Comes Before the Target
Before calculating a target, define the price behavior that would make the setup wrong.
For a double bottom, invalidation may involve price returning below the second low after the neckline breakout. For a flag, it may involve a break through the opposite side of the consolidation. For a breakout-and-retest entry, invalidation could be a decisive close back inside the original structure.
The exact rule depends on the trading method. What matters is that it is clear enough to determine the stop distance and position size.
A pattern with an attractive projected target but no defensible invalidation point is not yet a complete trade plan.
Measured Moves Are Projections, Not Predictions
Many chart patterns have conventional measurement techniques.
A rectangle may project the height of the range from the breakout. A head-and-shoulders pattern may use the distance from the head to the neckline. A flag may use the preceding impulse as a reference.
These measurements provide a consistent planning framework, not a promise that price will travel the full distance. Markets can stall at nearer support or resistance, reverse after a partial move or continue well beyond the projection. A measured move is best treated as one reference among several.
Forex Chart Patterns Cheat Sheet
The table is a reference, not a substitute for context. A formation can match textbook geometry and still offer a poor trade if the prior structure is unclear, the breakout is late, the pattern is poorly developed or execution costs make the opportunity unattractive.
Reversal Forex Chart Patterns
Reversal patterns attempt to identify situations in which an established trend is losing structure. They are potential turning structures, not automatic turning points. Trends can continue after apparently convincing reversal shapes, which is why completion and invalidation matter.
Double Top and Double Bottom
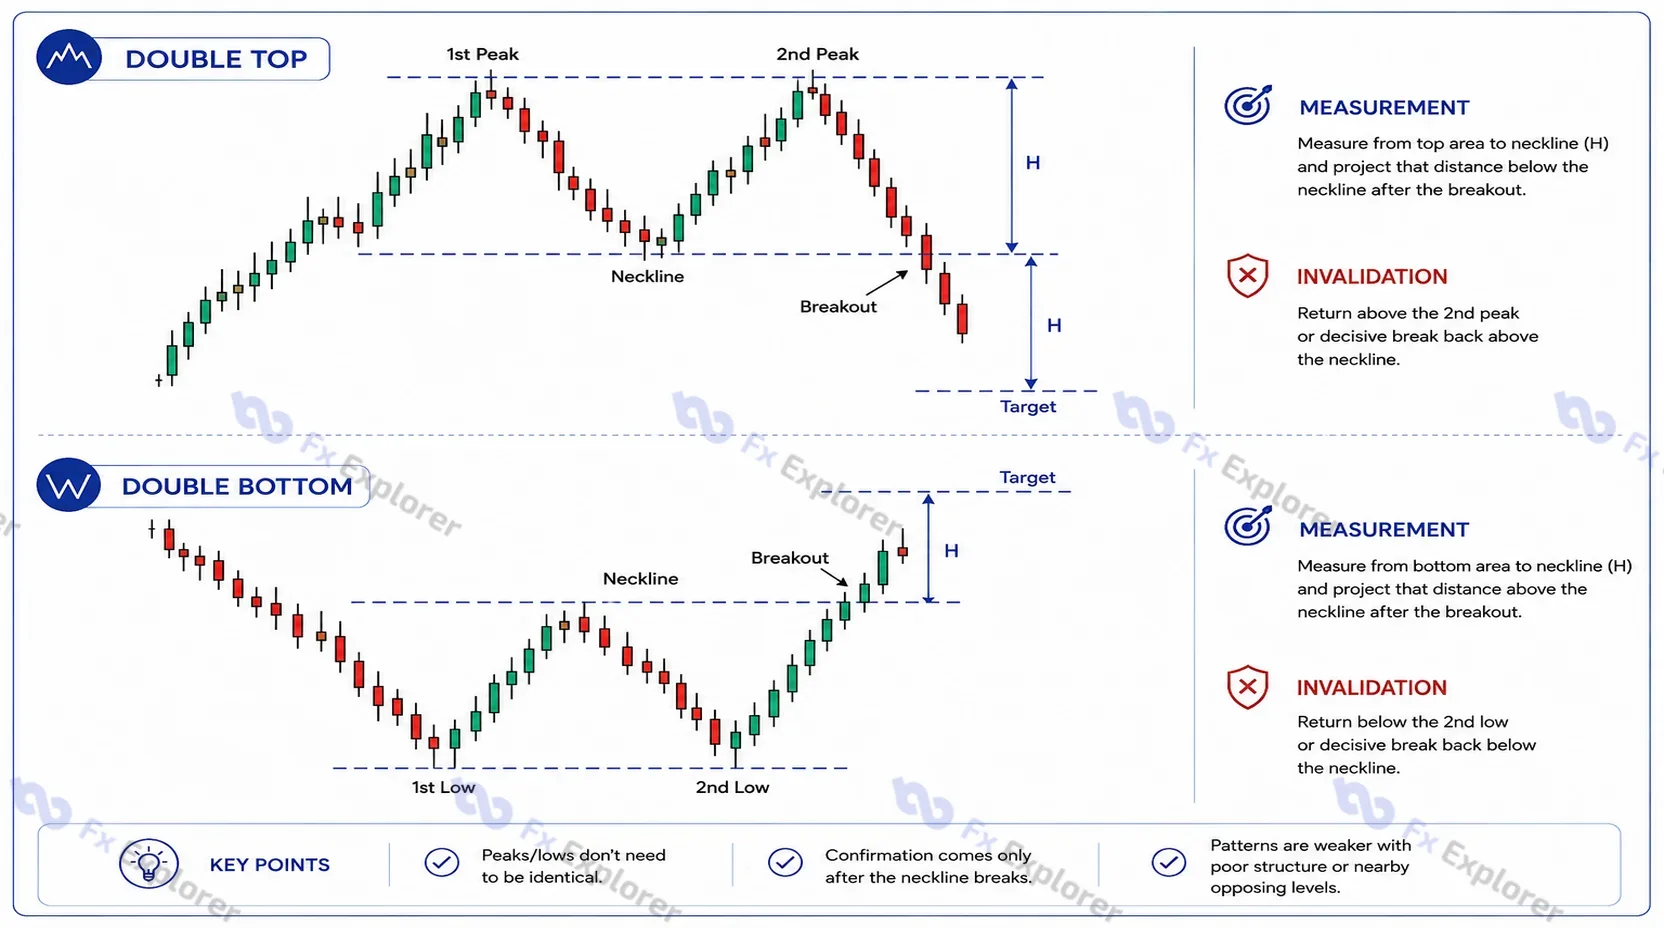
A double top forms after an advance when price tests a similar resistance area twice and fails to sustain a move above it. The two peaks are separated by an intervening swing low, which becomes the key confirmation level or neckline.
The pattern is not confirmed merely because the second peak appears. Until the intervening low breaks, the market may still be consolidating below resistance rather than reversing.
Once the neckline breaks according to the chosen confirmation rule, a common projection measures the vertical distance from the top area to the neckline and projects it below the breakout. Invalidation might involve a return above the second peak or a decisive failure back through the neckline, depending on the strategy.
The two peaks do not need to be identical. Real markets often produce slightly higher or lower second attempts. What matters is whether the second test of resistance fails and whether the intervening support subsequently breaks.
A double bottom is the mirror image. It develops after a decline when price tests a similar support region twice, with an intervening swing high between the lows. A break above that swing high indicates that the prior downward structure has changed, although the breakout can still fail.
The pattern is weaker when the two tests are barely separated, there is no meaningful prior trend, the intervening swing is poorly defined, or the breakout runs directly into nearby opposing structure.
Head and Shoulders and Inverse Head and Shoulders
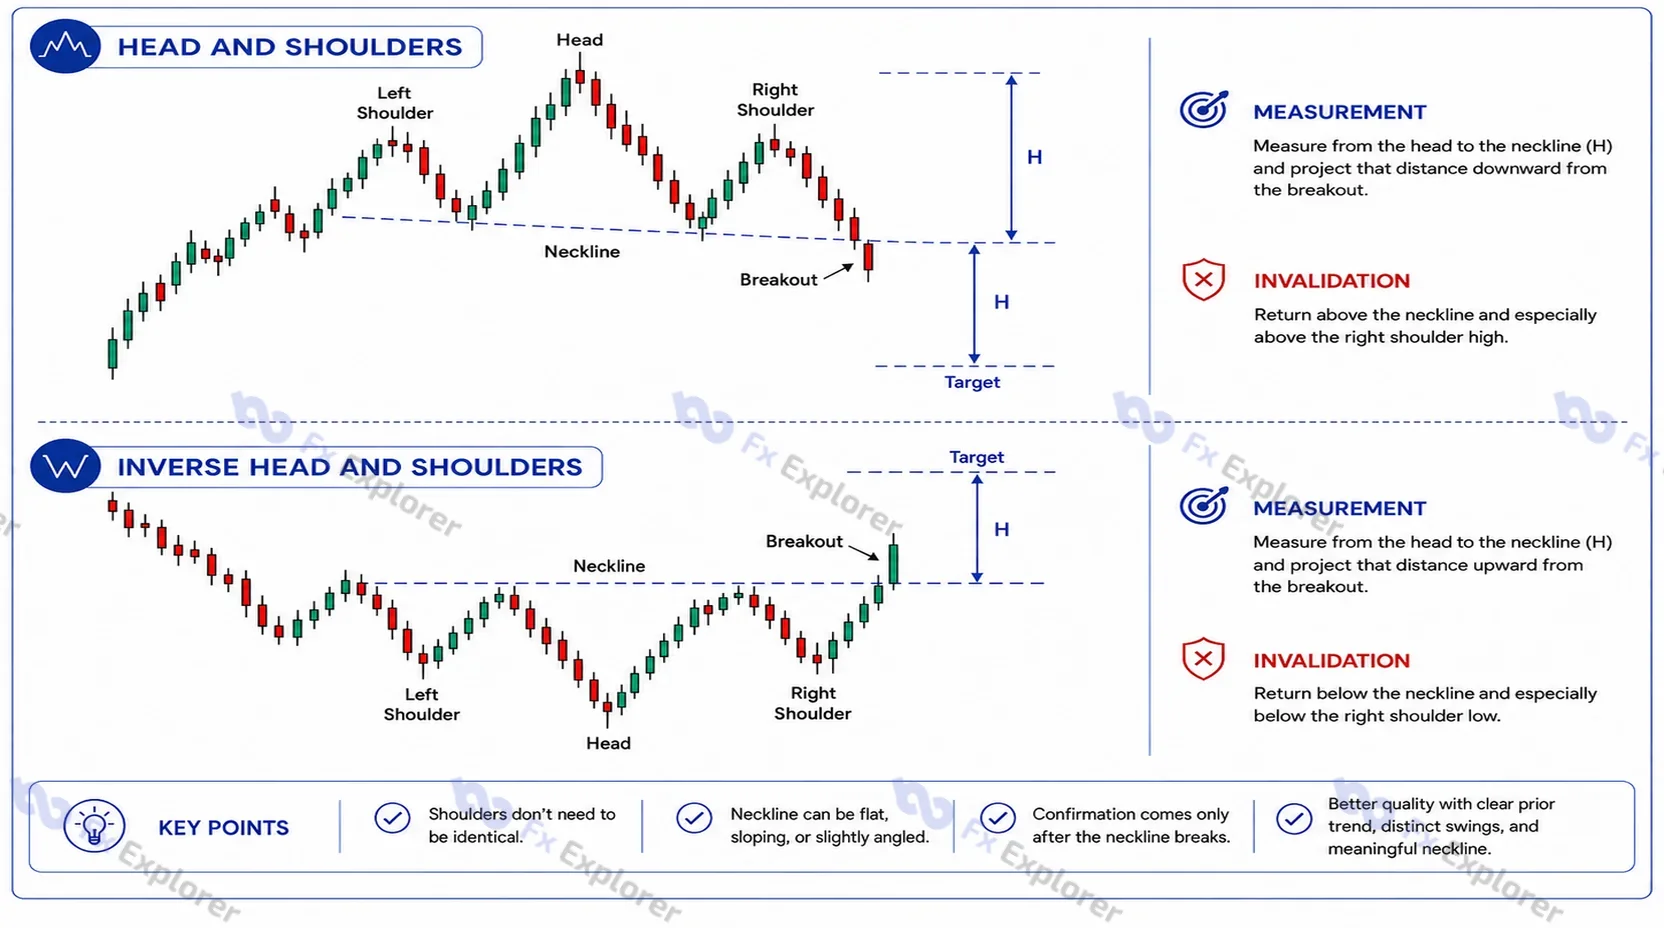
A head-and-shoulders pattern usually develops after an advance. It contains a left shoulder, a higher central peak called the head, and a right shoulder that fails to extend the previous bullish structure. The lows between the peaks form the neckline.
The shoulders do not need to be perfectly equal, and the neckline can slope. The structural idea matters more than visual symmetry: the market makes a final stronger high but then fails to rebuild the previous sequence of rising swings.
The pattern is generally considered complete only when price breaks the neckline under the chosen confirmation rule. A common projection measures the vertical distance from the head to the neckline and projects it downward from the breakout area.
An inverse head and shoulders forms after a decline and uses the same logic in reverse. The head is the deepest low, the shoulders are shallower lows and the neckline connects the intervening highs.
Pattern quality improves when the prior trend is clear, the shoulders are visually distinct, the neckline is meaningful and the breakout does not occur so late that the remaining reward is small relative to the stop. A highly ambiguous neckline or shoulders that can only be identified by ignoring major swings make the formation less convincing.
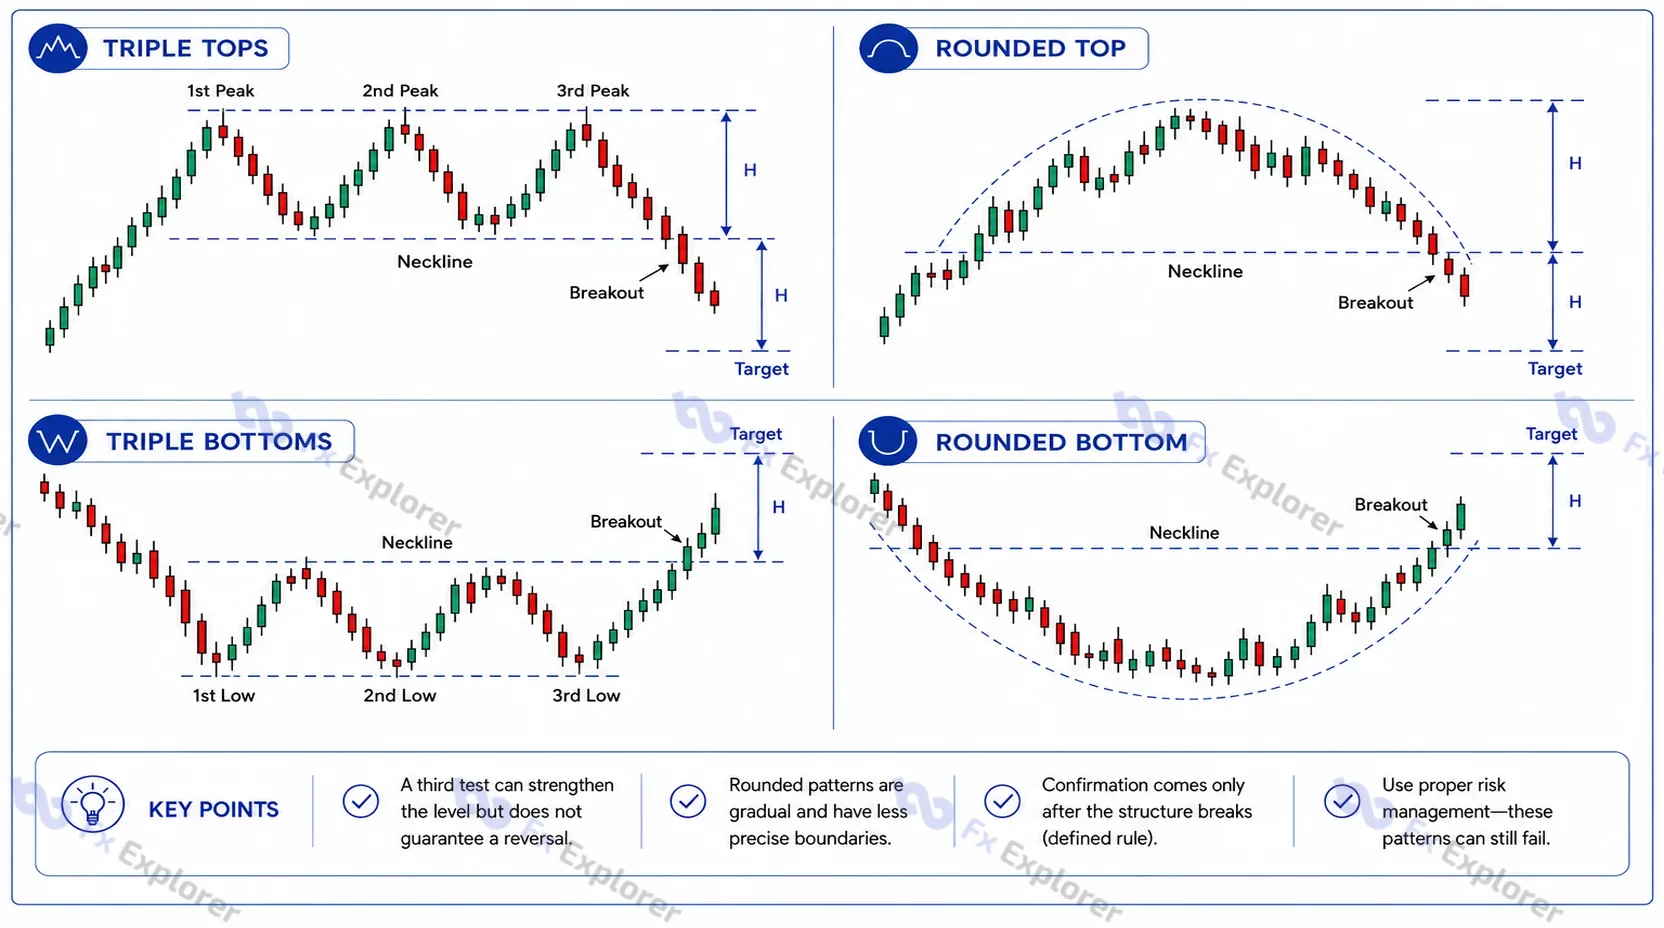
Triple Tops, Triple Bottoms and Rounded Reversals
A triple top adds a third failed test of resistance before support breaks. A triple bottom adds a third failed test of support before resistance breaks. The additional test can make the boundary more obvious, but it does not eliminate the possibility that price eventually breaks in the original trend direction.
Rounded tops and bottoms develop more gradually. Instead of distinct peaks or troughs, price changes direction through a broad curve. Because these structures can take longer to form and have less precise boundaries, confirmation and risk placement can be more subjective.
These formations are useful to recognize, but the core principle remains the same: a reversal pattern becomes actionable only when the underlying swing structure changes under a defined rule.
Continuation Forex Chart Patterns
Continuation patterns usually develop after a directional move and represent a pause, retracement or compression. Their interpretation depends heavily on the quality of the move that preceded them. A small consolidation without a meaningful prior impulse is not automatically a flag or pennant.
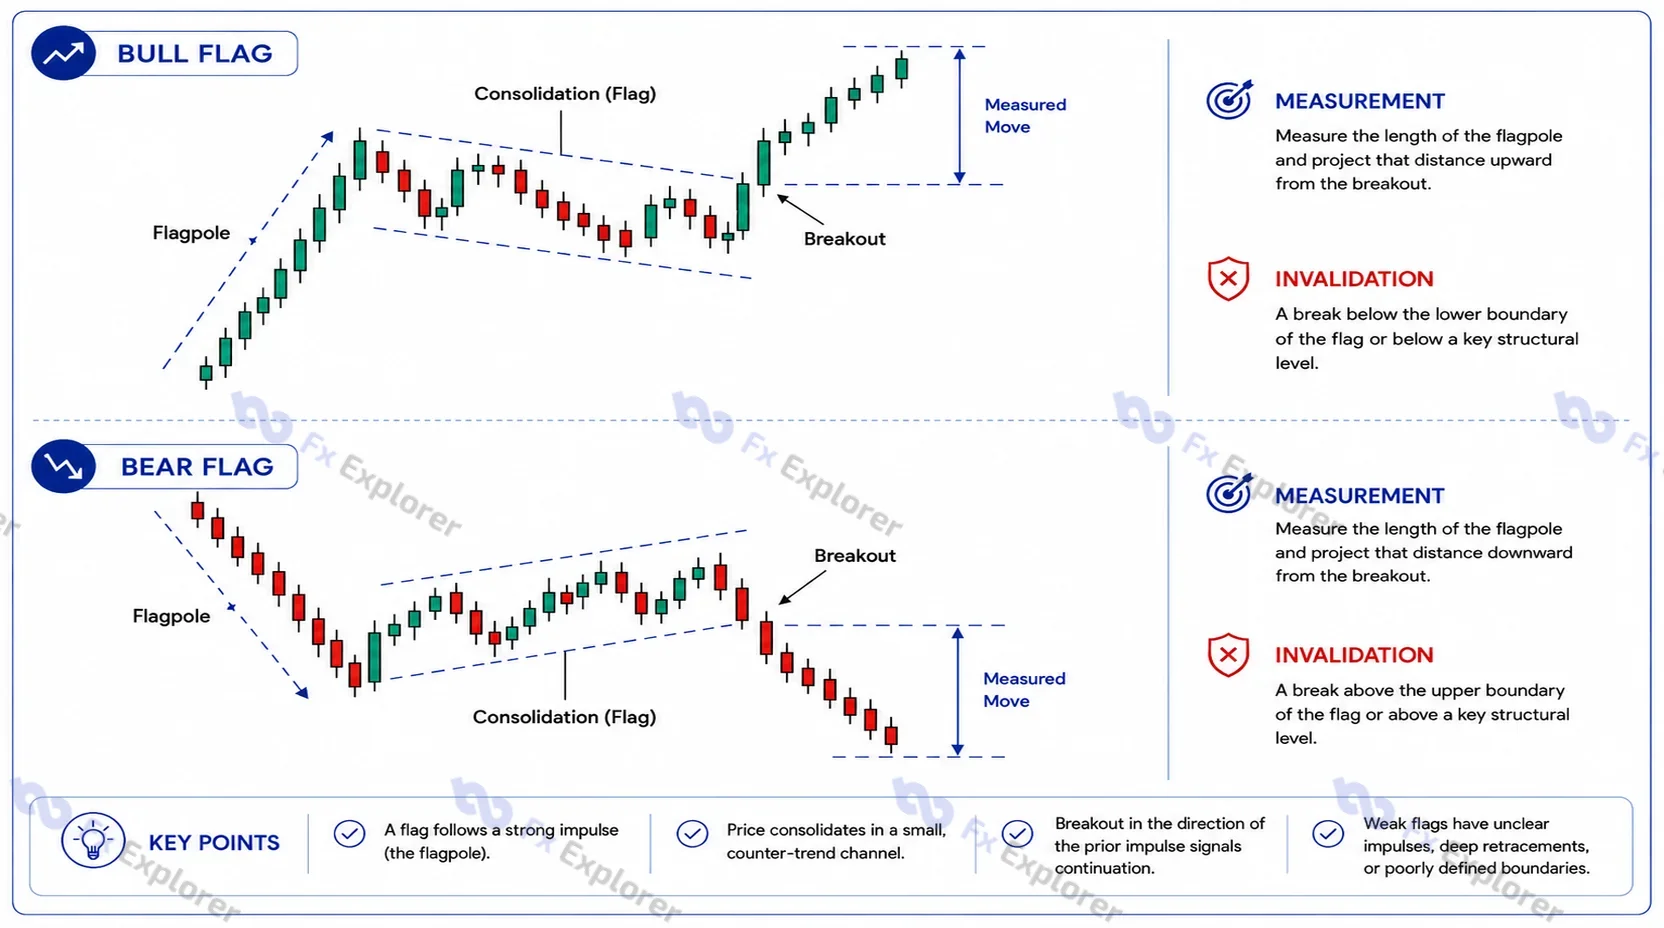
Bull and Bear Flags
A bull flag typically starts with a strong upward impulse known as the flagpole. Price then consolidates in a smaller downward-sloping or sideways channel. A continuation setup develops if price breaks the upper boundary and resumes the prior direction.
A bear flag is the mirror image: a strong downward move followed by a smaller upward or sideways consolidation, with continuation considered if price breaks lower.
A flag differs from an ordinary channel because it is interpreted relative to a clear preceding impulse. If price has been drifting inside parallel boundaries for a long period without a distinct directional leg, calling the whole structure a flag adds little information.
A common projection uses the flagpole length, but that objective should still be compared with nearby support or resistance. Invalidation may sit beyond the opposite side of the flag or another structural level specified by the strategy.
A weak flag often contains an indistinct impulse, excessive retracement, poorly defined boundaries or a consolidation that expands into a broader range.
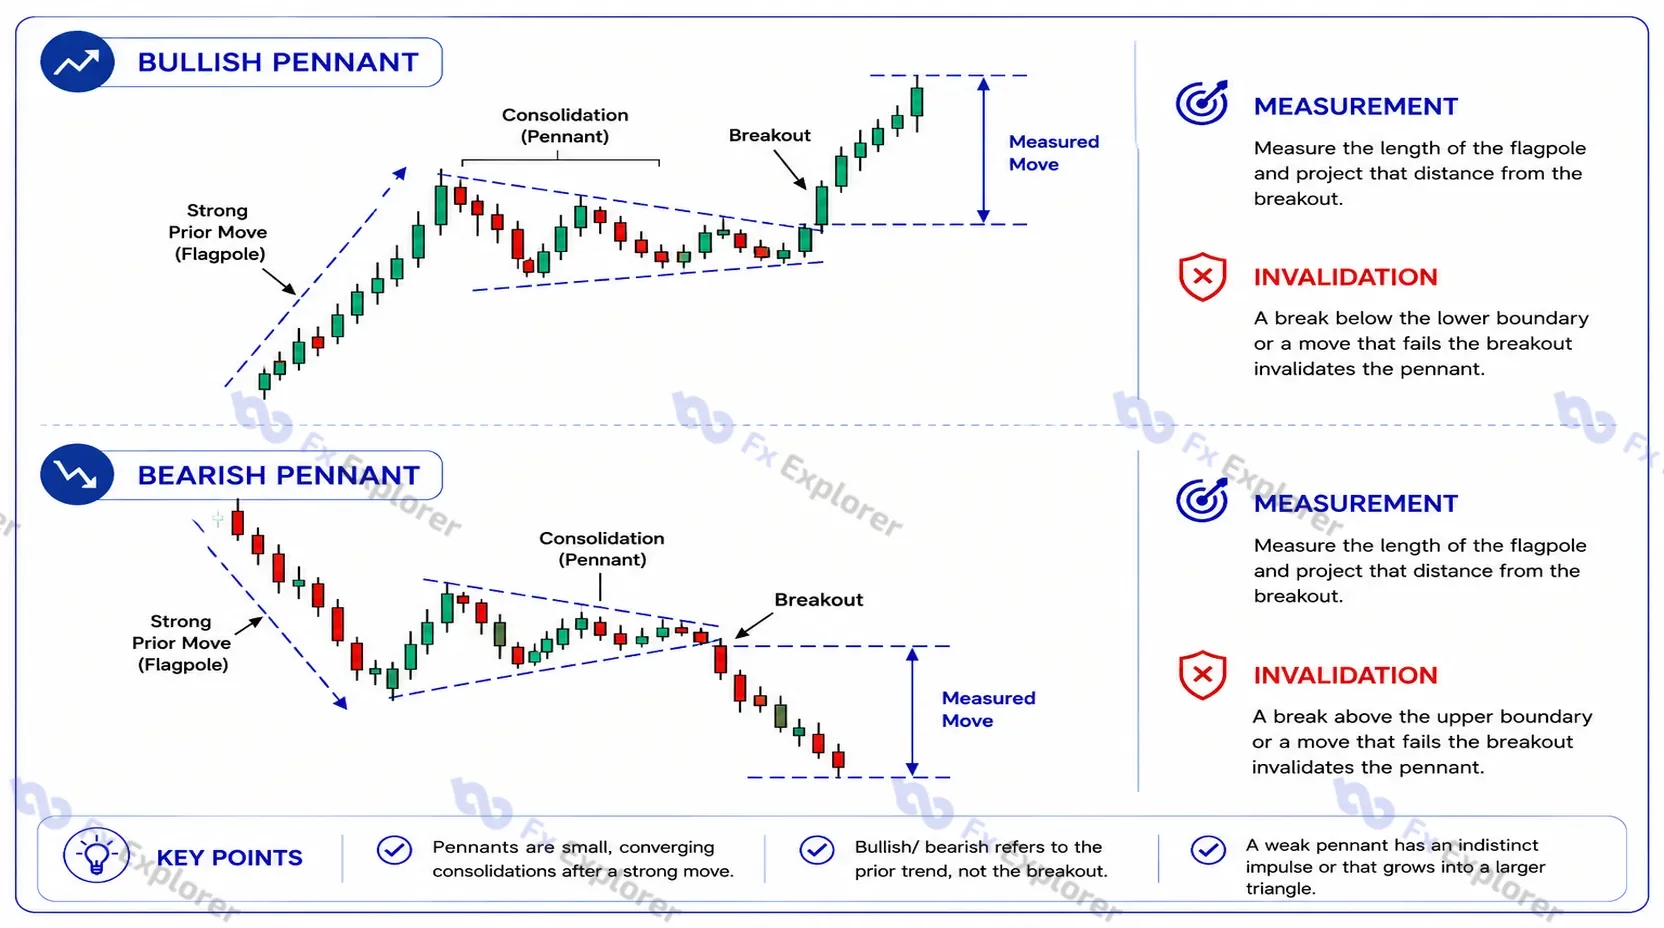
Bullish and Bearish Pennants
A pennant also follows a strong directional move, but its consolidation contracts into a small converging structure rather than a parallel channel.
The distinction between a pennant and a symmetrical triangle is mainly contextual and proportional. A pennant is usually relatively small and attached directly to a sharp impulse. A symmetrical triangle can form without a comparable flagpole and may develop over a much larger area.
Bullish and bearish labels describe the preceding context, not a guaranteed breakout direction. A bullish pennant can fail downward, while a bearish pennant can resolve upward.
A structure becomes less convincing as a pennant when the preceding impulse is weak or the consolidation persists long enough to become a larger independent triangle.
Rectangle Patterns
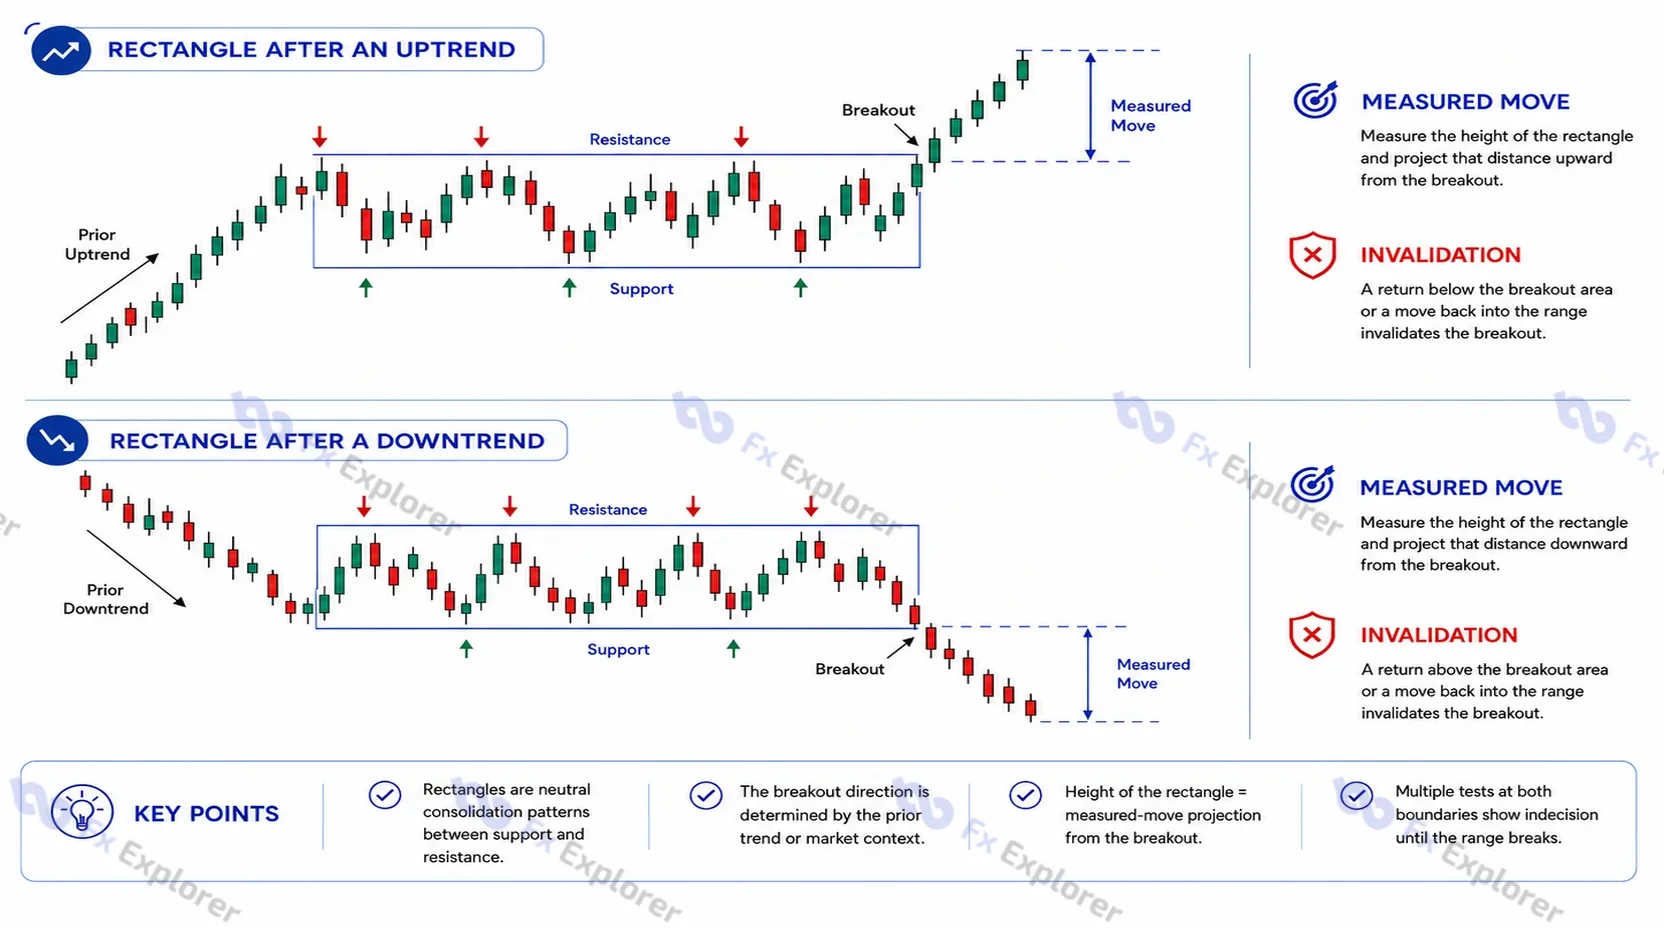
A rectangle forms when price oscillates between relatively clear horizontal support and resistance.
After an uptrend, traders may watch for an upside breakout as a possible continuation. After a downtrend, they may watch for a downside resolution. The rectangle itself remains neutral until price breaks the range.
The height of the rectangle is commonly projected from the breakout as a measured-move reference. Invalidation can involve a return through the breakout area or deeper movement back into the range, depending on the strategy.
Repeated failed attempts at both boundaries may make the range easy to identify, but they also show that neither side has established control until the structure resolves.
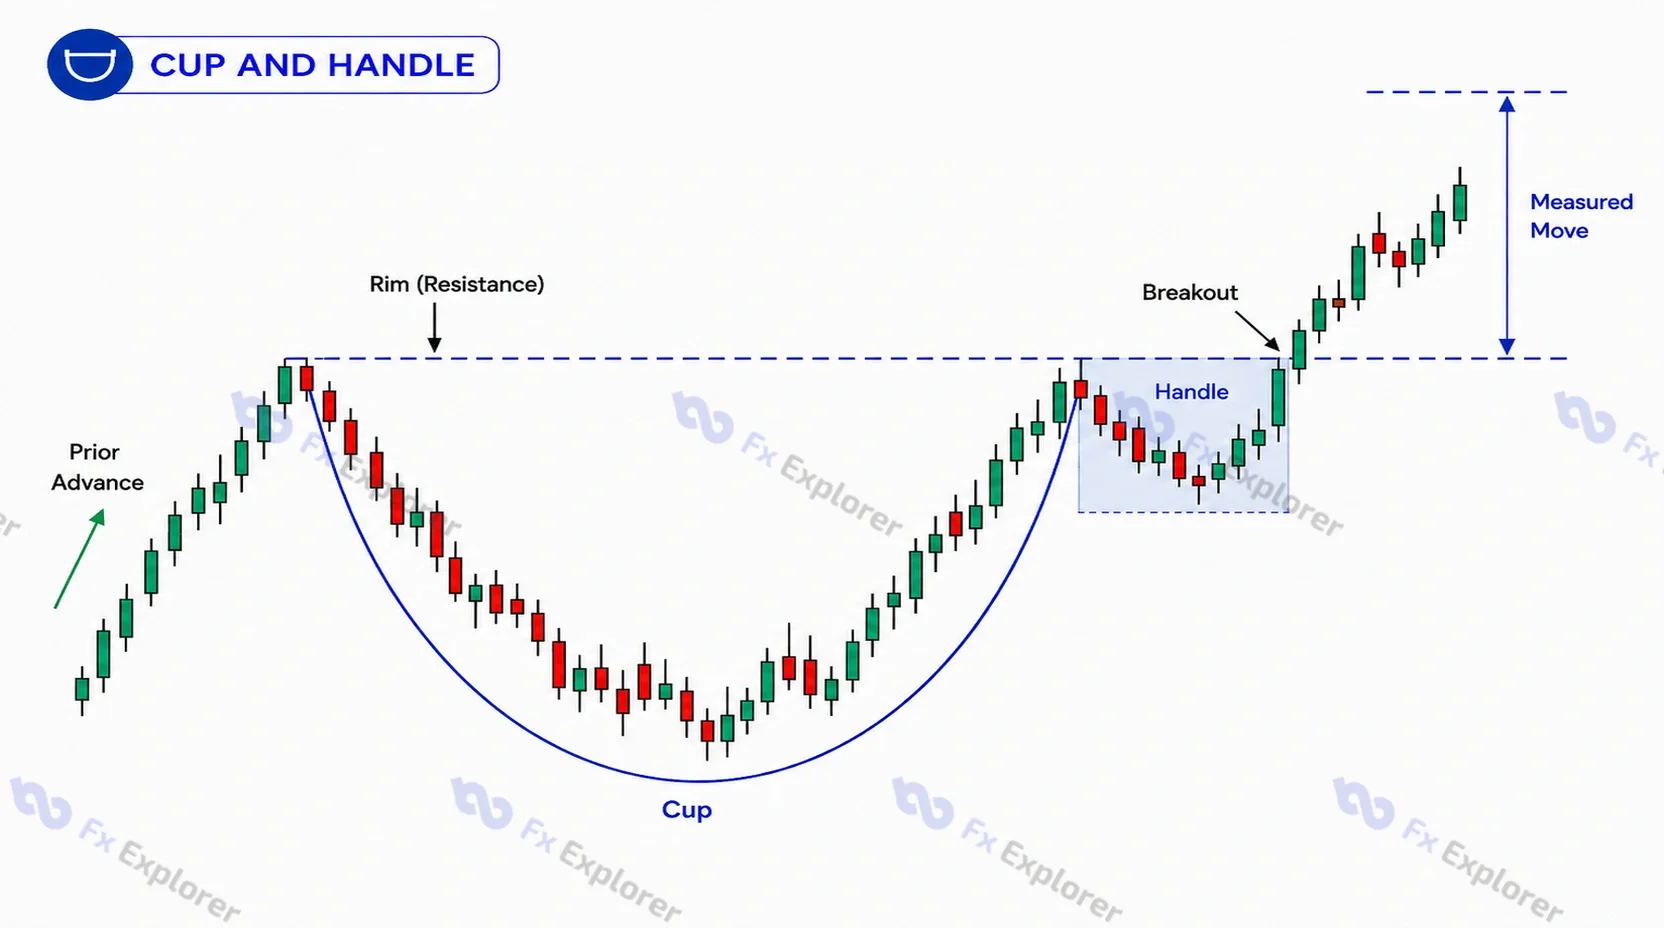
Cup and Handle
The cup and handle is a slower bullish continuation structure. The cup forms through a rounded decline and recovery, while the handle is a smaller pullback or consolidation near the prior high. A breakout above the rim completes the pattern under many definitions.
The prior advance, quality of the rounded recovery, depth of the handle and breakout behavior all matter. A shape that merely resembles a cup is not automatically a useful setup.
Cup-and-handle formations are worth recognizing as classical chart patterns, although they tend to appear less frequently than structures such as flags, triangles or double tops.
Triangle Forex Chart Patterns
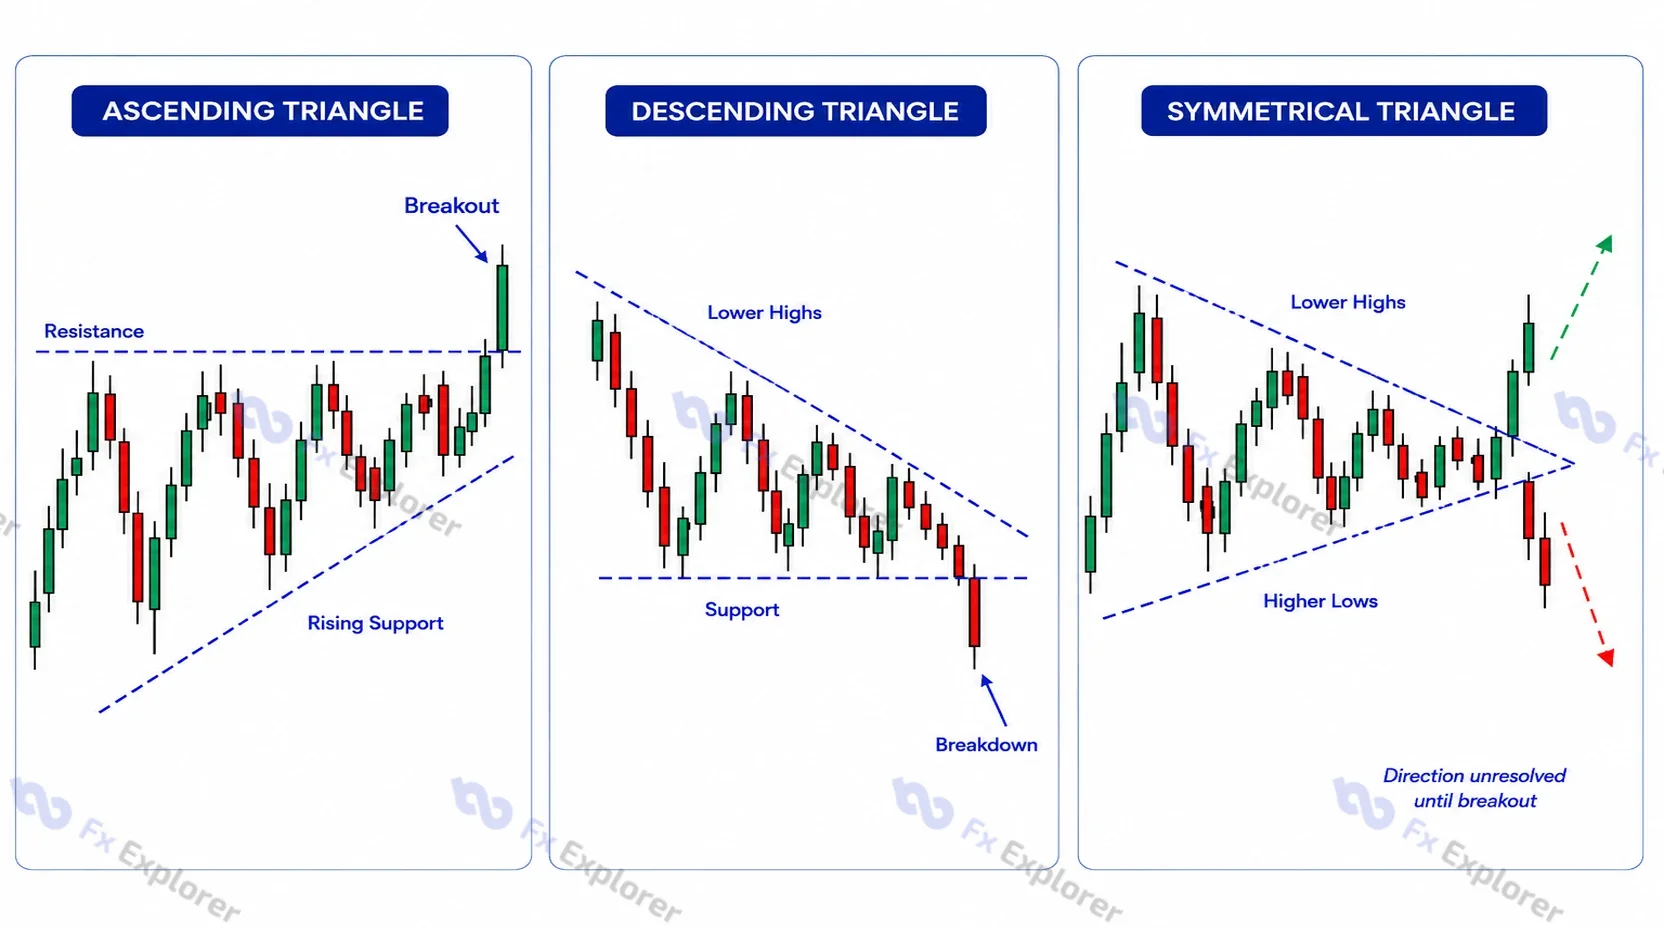
Triangles represent contracting price ranges. They organize the changing relationship between buyers and sellers around converging boundaries but do not determine breakout direction in advance.
Ascending Triangle
An ascending triangle forms when price repeatedly tests relatively horizontal resistance while the lows rise. Buyers are willing to transact at progressively higher prices, but resistance remains unresolved.
The formation often carries a bullish expectation, yet price can still break lower. It remains conditional until one boundary is resolved.
A common target projection uses the triangle's maximum height and projects it from the breakout. Invalidation may involve a failure back beneath the breakout level or a break through the rising support structure.
The pattern becomes weaker when the supposedly horizontal resistance is poorly defined or the rising lows are so irregular that the lower boundary has little structural meaning.
Descending Triangle
A descending triangle combines relatively horizontal support with lower highs. Sellers repeatedly appear at lower prices while support continues to hold.
The structure often carries a bearish expectation, but an upside breakout remains possible. As with an ascending triangle, the confirmation rule should determine when the setup becomes active.
A convincing descending triangle needs more than one arbitrary descending trendline. The repeated support tests and sequence of lower highs should be visible without extensive adjustment.
Symmetrical Triangle
A symmetrical triangle contains lower highs and higher lows. Both boundaries converge, creating progressively narrower swings.
Because neither side is horizontal, the formation is a clear example of why direction should not be predicted while price remains inside the pattern. The preceding trend may influence expectations, but the structure itself remains unresolved until a boundary breaks.
A very tight triangle can also become difficult to trade if the breakout occurs during spread expansion or a high-volatility event. Attractive geometry does not automatically create attractive execution.
Rising and Falling Wedge Patterns
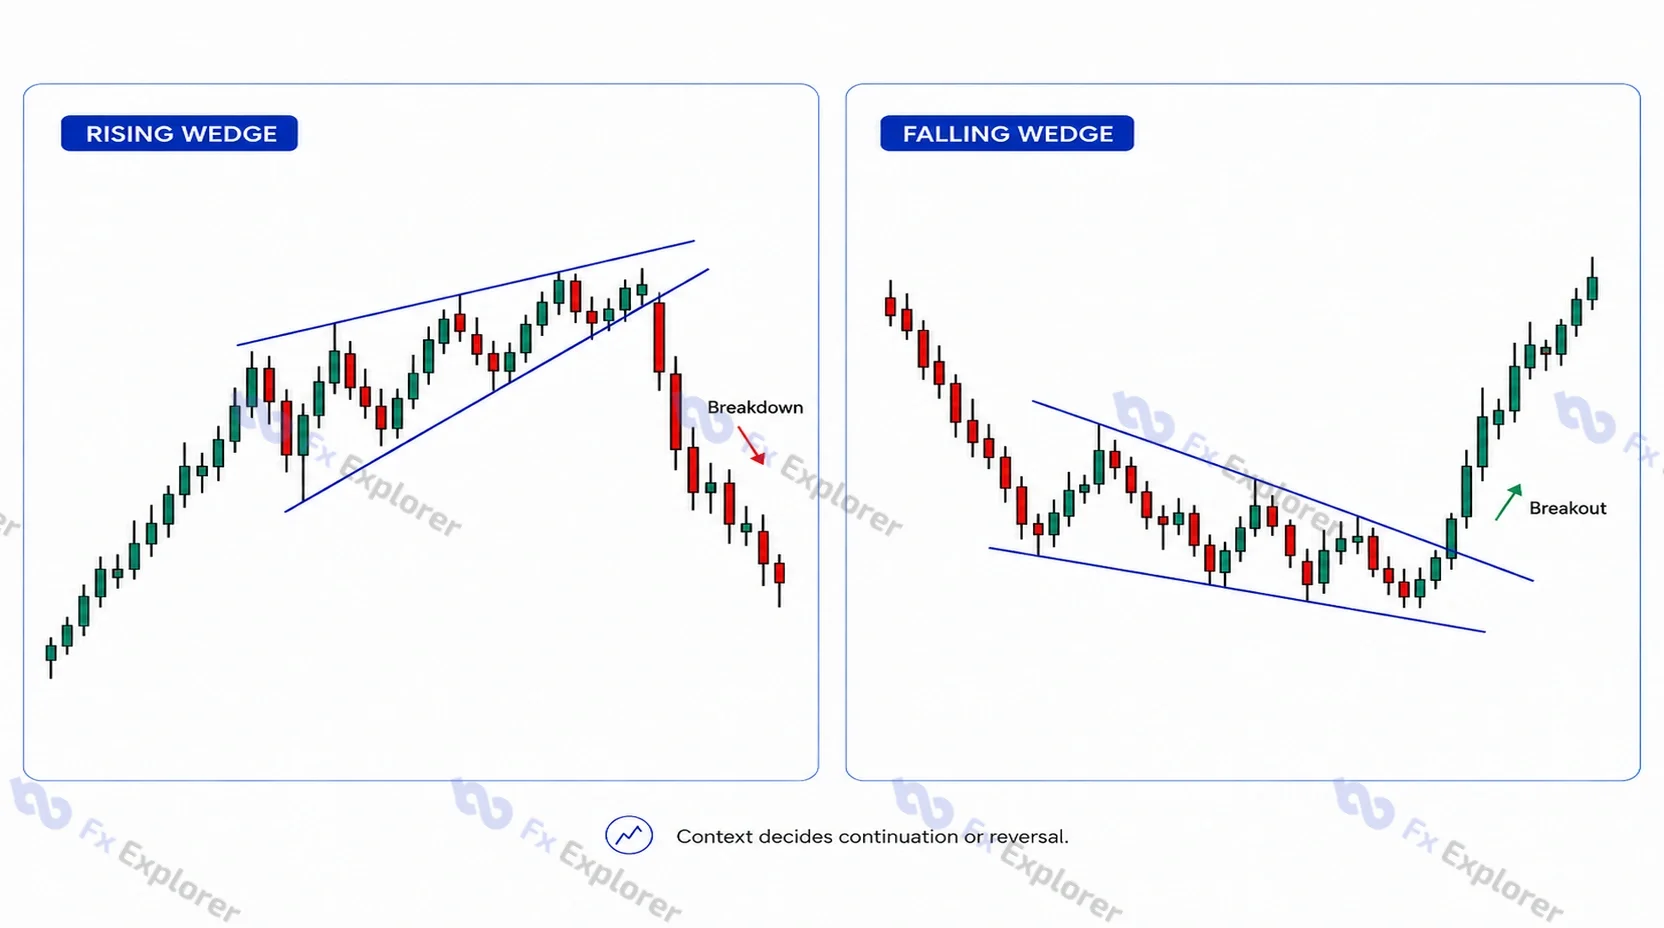
Wedges are frequently confused with triangles because both contain converging boundaries. The difference is that both sides of a wedge slope in the same general direction.
Rising Wedge
A rising wedge forms as price makes higher highs and higher lows while the boundaries converge. Upward progress becomes less efficient because each new advance produces less expansion.
The structure is often interpreted as bearish. Near the end of an uptrend, it can act as a reversal. Inside a broader downtrend, it can appear as a countertrend consolidation before continuation lower.
A rising wedge becomes less persuasive when the boundaries are not genuinely converging or when there is no clear directional context to explain why the structure matters.
Falling Wedge
A falling wedge contains lower highs and lower lows with converging boundaries. It is commonly interpreted as bullish.
After a decline, it may behave as a reversal pattern. Inside a larger uptrend, it may act as a continuation structure.
Wedges therefore cannot be classified correctly from shape alone. Prior trend and location determine whether the pattern is functioning as continuation or reversal.
Flag vs. Pennant vs. Triangle vs. Wedge vs. Channel
These formations are often confused because all can contain diagonal boundaries.
A rectangle differs because its defining boundaries are horizontal. The labels help organize price action, but they should not be forced when the structure is ambiguous.
Trend Channels and Market Structure
Not every useful market pattern needs a famous name. Rising channels, falling channels and repeated swing sequences can describe trend behavior directly.
A rising channel generally contains higher highs and higher lows within approximately parallel boundaries. A falling channel contains lower highs and lower lows. These structures help define direction and areas where price has repeatedly reacted.
A channel break is a warning that the existing structure may be changing, not automatic reversal confirmation. Price can break a channel, consolidate and resume the original trend. A stronger reversal case normally requires a broader change in swing structure.
Less-Common Structures
Some chart formations appear less often, are more subjective to identify, or use a more specialized framework than the major classical patterns covered above.
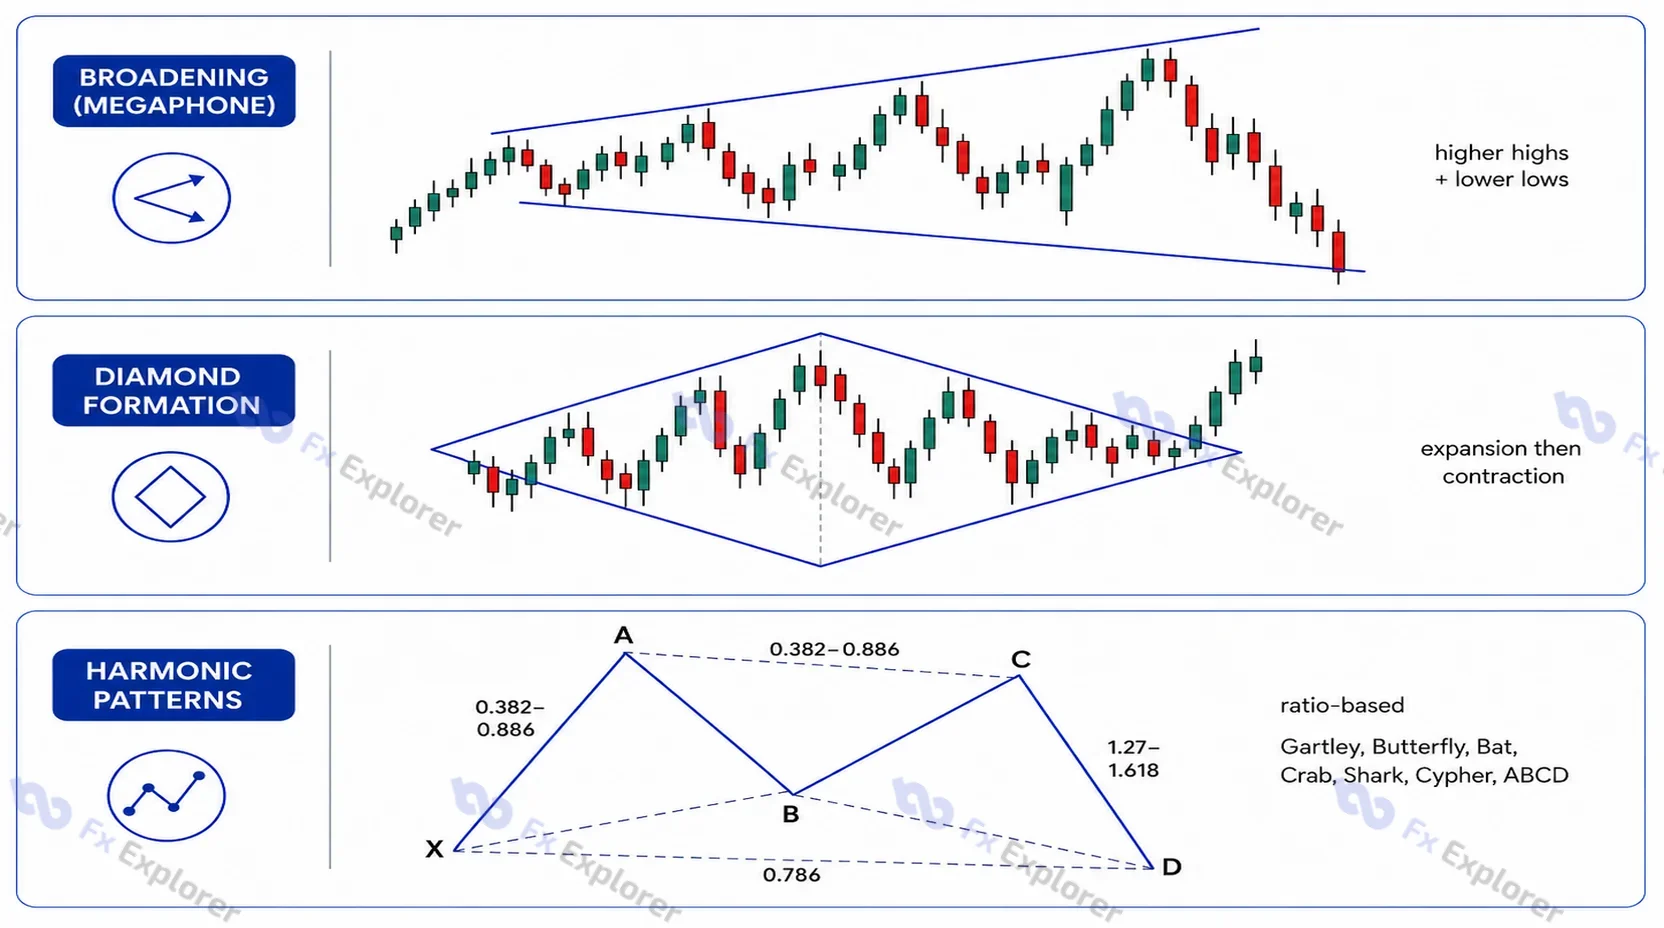
Broadening or megaphone formations expand rather than contract, with price producing increasingly wider swings and often forming higher highs alongside lower lows. This distinguishes them from triangles and wedges, whose boundaries converge.
Diamond formations combine an expansion phase with a later contraction phase, creating a roughly diamond-shaped structure. Their boundaries can be less precise than those of common triangles or rectangles, so identification may be more subjective.
Harmonic patterns are a separate group that includes the Gartley, Butterfly, Bat, Crab, Deep Crab, Shark, Cypher and ABCD patterns. Unlike classical chart patterns, they rely on specific price proportions and Fibonacci relationships rather than visual geometry alone, which is why they are usually studied as a distinct ratio-based methodology.
These formations expand the range of structures a trader may encounter, but they are best treated as supplementary frameworks rather than substitutes for the core classical patterns discussed in this guide.
How to Trade Forex Chart Patterns
Once a structure is identified, the trading process should turn it into a conditional plan. Confirmation, invalidation and risk should be established before position size is chosen.
Entry Choices
A breakout entry acts as price moves through the pattern boundary. It can provide a favorable price but creates greater exposure to false breaks.
A confirmed-close entry waits for a candle to close beyond the boundary. This filters some intrabar noise but may result in a later entry and greater distance from invalidation.
A breakout-and-retest entry waits for price to break the structure and then return toward the previous boundary. Former resistance may hold as support after an upside breakout, or former support may act as resistance after a downside break. The trade-off is that many valid breakouts never retest.
Some strategies use a stop-entry order positioned beyond a pattern boundary so that the order activates only if price reaches the breakout level. This can automate part of the execution process, but the trigger price is not necessarily the final fill. During rapid movement, gaps or thin liquidity, execution can occur at a worse price.
None of these methods is universally superior. The entry rule should be chosen before the outcome is known and tested consistently.
Where the Stop Belongs
The stop should relate to pattern invalidation.
The trader should first decide what price behavior would show that the intended breakout, continuation or reversal has failed. The stop can then be placed according to that structure, with position size adjusted to keep the potential cash loss within the selected limit.
Choosing a preferred lot size first and forcing the stop to fit reverses the process. If a valid structural stop is too wide for the account, the position should be reduced or the trade skipped.
Setting a Target
Measured moves provide one target framework, but they are not the only option.
Nearby support or resistance, previous swing highs or lows, partial exits, trailing stops and changes in market structure can also shape an exit plan.
If a measured move projects 80 pips but major resistance sits 25 pips away, the nearer structure deserves consideration. A geometric projection does not override what is directly ahead of price.
Position Size and Risk
The sequence should remain:
Suppose a trade has a 35-pip structural stop and the trader is prepared to lose no more than $7 including costs. If spread, commission and expected slippage are estimated at $1, only $6 remains for adverse price movement.
The position must then be small enough that a 35-pip loss does not exceed that $6 price-risk allowance.
The chart pattern itself does not make the trade safer. It provides a framework for deciding where the idea is no longer valid. If several pattern trades can be open together, total portfolio exposure also matters; separate positions can concentrate risk when they depend on the same currency move.
Spread, Slippage and Pattern Size
Trading costs matter more when the expected move is small.
If a pattern projects only 12 pips and the combined spread and likely slippage consume 3 pips, a substantial part of the opportunity disappears before any net profit is possible.
This is especially relevant on lower timeframes. A technically clean formation can still be economically unattractive.
Timeframes and Higher-Timeframe Context
There is no universally best timeframe for forex chart patterns.
Smaller timeframes produce more observations and potential setups, but they can contain more short-horizon noise and make trading costs proportionally more important. Larger structures develop more slowly and may require wider stops.
A practical multi-timeframe process separates three tasks. The higher timeframe establishes the broader trend and major support or resistance. The trading timeframe defines the pattern. A lower timeframe, if used, can refine execution without changing the original invalidation logic.
Patterns can also be nested. A small bull flag may develop inside a larger bearish channel, or a lower-timeframe breakout may run directly into higher-timeframe resistance. The smaller pattern can still be valid, but the surrounding structure changes how much room the trade has to develop.
Market Conditions Change Pattern Quality
Pattern geometry should not be evaluated independently of the environment in which it forms.
In a sustained trend, continuation structures such as flags and pennants have a clear directional context. Inside a range, horizontal boundaries may be easy to identify, but repeated breaks can fail because neither side has established lasting control.
High-volatility conditions can produce larger breakouts and wider swings, yet they can also increase stop distance, slippage and the chance that price briefly exceeds a boundary before reversing. Low-volatility compression can create well-defined triangles or narrow ranges, but compression alone does not determine which direction the eventual expansion will take.
Liquidity matters as well. A technically valid breakout during a thin trading period can occur with wider spreads or unstable execution. An otherwise attractive chart pattern may therefore be unsuitable once real trading conditions are considered.
Volume in Forex Chart Patterns
Volume confirmation needs special treatment in forex because the market is decentralized.
Retail spot-FX platforms do not generally display one consolidated global volume figure representing every transaction across the currency market. Some platforms show tick volume or activity from a particular venue or liquidity source. Exchange-traded currency products may provide centralized volume for that specific market.
Those data can still be useful if the trader understands what they represent. What should be avoided is a universal rule such as “a breakout is valid only when global forex volume rises.”
Volume can support an analysis, but it does not replace price structure, confirmation or risk management.
Other Confirmation Tools
A chart-pattern strategy may incorporate momentum, volatility, relative strength, sentiment, support/resistance confluence or economic context.
A predefined candlestick rule can also form part of confirmation. For example, a strategy might require a breakout candle to close beyond a boundary or use a rejection pattern during a retest. That does not turn the larger chart pattern into a candlestick strategy; the candle simply becomes one defined component of the execution rule.
These tools should support a consistent process rather than be added simply to create more signals. If an indicator or candle condition is part of confirmation, its use should be specific and testable.
How to Practice Recognizing Forex Chart Patterns
Pattern recognition improves when the trader practices on charts without already knowing how the setup ended.
Looking backward at a completed chart makes formations appear cleaner because the eventual breakout reveals which swings mattered. A better exercise is to stop the chart while the structure is still developing.
Mark the prior trend, important swing highs and lows and any plausible boundaries. Decide whether the pattern is sufficiently developed to name, then write down what would complete it and what would invalidate the interpretation. Only after those decisions are recorded should later price action be revealed.
Practice should include patterns that fail, structures that never complete and charts that remain too ambiguous to classify. If the exercise consists only of finding textbook examples after successful breakouts, pattern recognition becomes heavily affected by hindsight.
Screenshots can help. Keeping the original chart together with the later outcome makes it easier to see whether the initial boundaries were reasonable or were unconsciously adjusted after price moved.
The goal is not faster shape naming. It is more consistent separation of clear, testable structure from formations that exist mainly because the outcome is already known.
Automated Pattern Recognition and Scanners
Pattern scanners can search many pairs and timeframes for structures that meet predefined geometric rules. Their main advantage is consistency: software can apply the same tolerance for swing spacing, trendline slope or breakout conditions repeatedly.
The limitation is false identification.
A scanner may detect a triangle forming directly beneath major resistance, a double top with no meaningful prior trend or a flag whose preceding impulse is too weak to justify the classification.
Automated recognition can therefore help find candidates, but it does not remove the need to evaluate market context, pattern quality, confirmation, invalidation, costs and position size.
The more subjective the formation, the more carefully the scanner's rules need to be tested.
Why Forex Chart Patterns Fail
Failed patterns are not unusual exceptions. Any viable chart-pattern method needs to expect them.
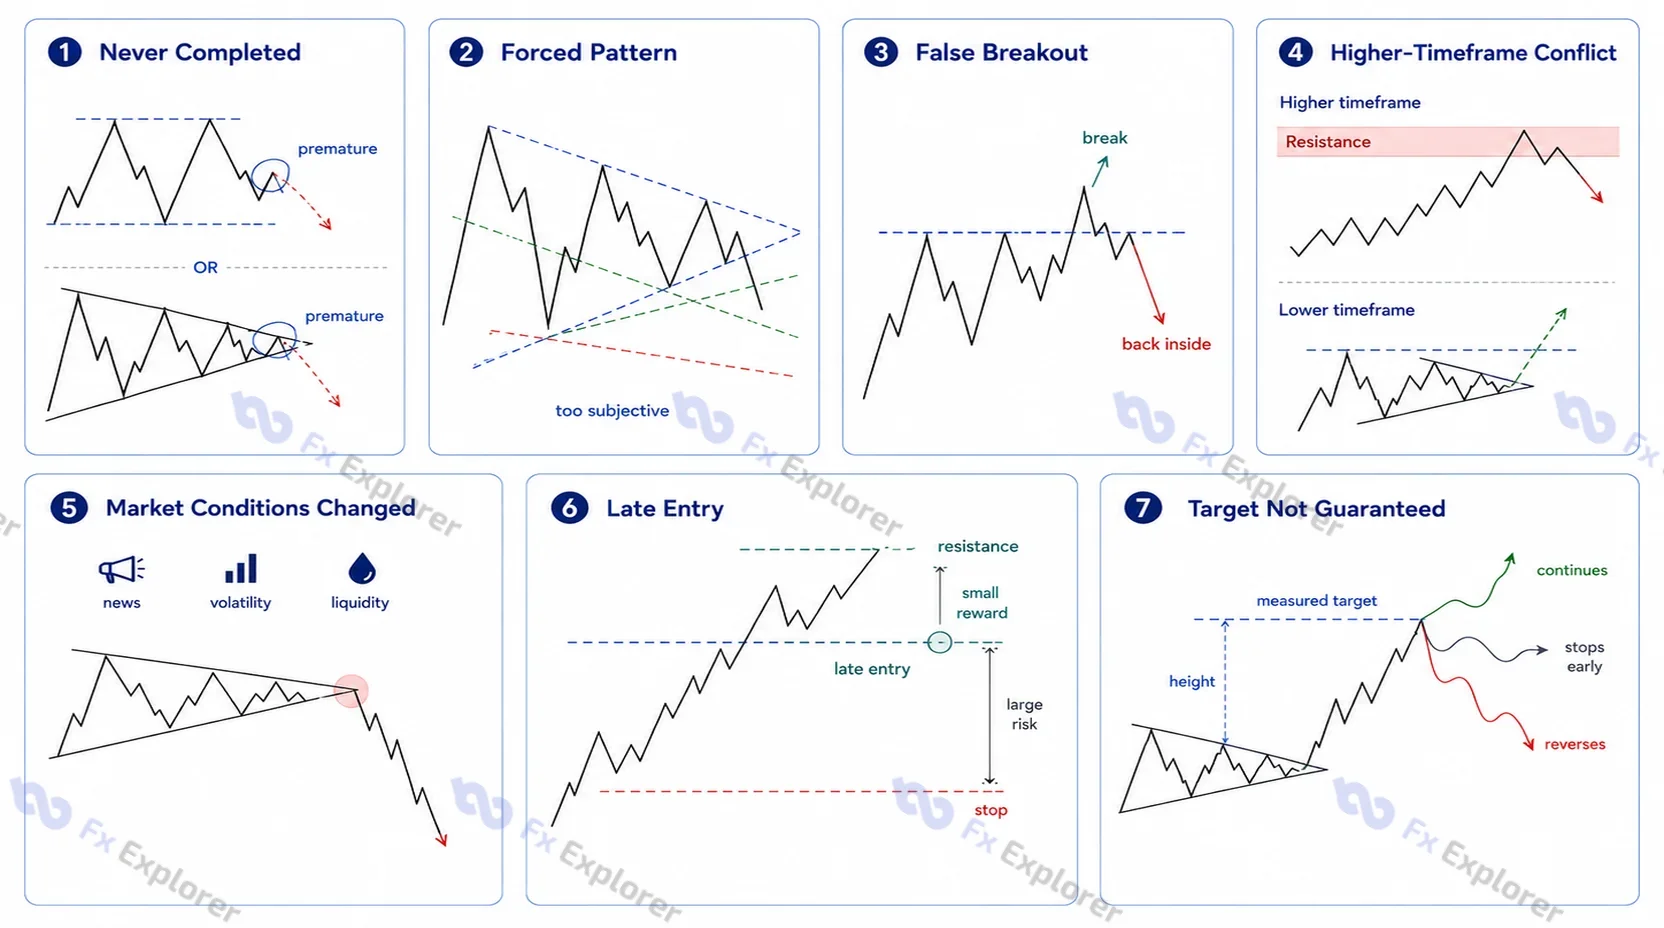
The Pattern Was Never Completed
A trader may enter while the structure is still forming.
A second high appears, so a double top is assumed before support breaks. A triangle looks mature, so the trader predicts the breakout direction before either boundary has resolved.
Anticipation is legitimate only when it is defined and tested as a separate strategy. It should not be confused with confirmed-pattern trading.
The Pattern Was Forced
A trader can almost always draw lines that make recent price resemble a familiar structure.
If trendlines cut through major swings, the neckline changes every few candles or several contradictory patterns can be drawn on the same area, the structure may be too subjective for reliable testing.
False Breakout
A false breakout occurs when price moves beyond a pattern boundary and then returns through it.
A wick through the level may be only a temporary breach. A candle close outside the structure is stronger evidence, but closing breakouts can also fail. Price may even break, retest successfully and reverse later.
A temporary breach trades beyond the boundary but quickly returns. A closing breakout ends a candle outside the structure. A failed breakout moves outside and then re-enters the pattern. A failed retest occurs when the breakout initially appears to hold but later loses the former boundary.
Depending on direction, failed breakouts are sometimes described as bull traps or bear traps.
Confirmation reduces uncertainty; it does not remove it.
Higher-Timeframe Conflict
A bullish breakout on a 15-minute chart may occur directly below a major daily resistance zone.
The lower-timeframe structure can still produce a move, but the larger level may limit its potential. Ignoring that context can make a valid pattern appear more attractive than it is.
Market Conditions Changed
Economic announcements, sudden volatility, thin liquidity or major repricing of interest-rate expectations can overwhelm a previously orderly formation. Spread and slippage may deteriorate at the same time.
The Entry Was Too Late
A pattern can remain valid while the trade has become unattractive.
If price has already moved far beyond the breakout, the distance to invalidation may be large while the remaining distance to resistance or the projected target is small.
Chasing a breakout can turn good structure into poor risk-to-reward.
The Measured Target Was Treated as Guaranteed
Measured moves are planning references. Price can stop early, reverse at nearby structure or continue beyond the projection. A method that assumes the full target must be reached will overstate expected reward.
Worked EUR/USD Chart-Pattern Example
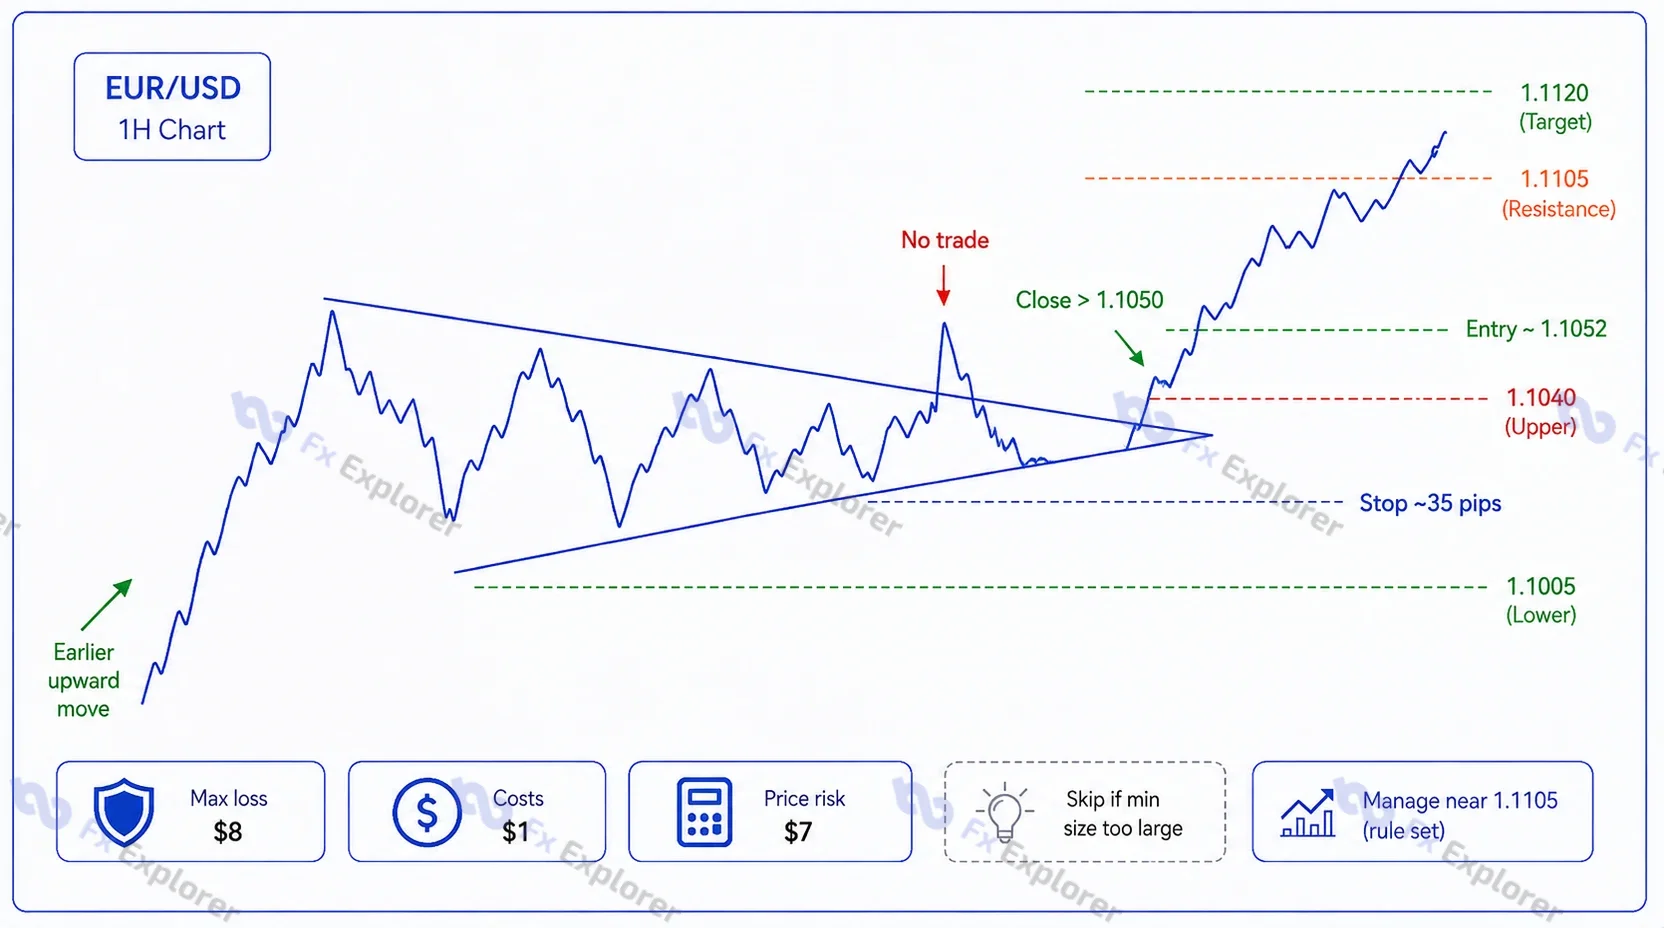
Consider an illustrative EUR/USD symmetrical triangle after an earlier upward move.
Price forms lower highs and higher lows over several sessions. The upper and lower boundaries converge, and the structure remains unresolved while price trades inside them.
Assume the upper boundary is near 1.1040 as the pattern matures. The lower side is near 1.1005, and the widest portion of the triangle measures approximately 70 pips.
The trader's rules require a one-hour candle to close above the upper boundary before a long setup becomes active.
Price initially trades above 1.1040 during one candle but closes back inside the triangle. No trade is taken because the confirmation rule has not been met.
Several hours later, a candle closes at 1.1050 above the boundary. The trader now treats the breakout as confirmed. A retest is not required by the strategy, so the planned entry is near 1.1052 after allowing for the spread.
The invalidation rule places the stop below the most recent higher low and back inside the triangle, approximately 35 pips below the entry.
The 70-pip triangle height produces a theoretical measured projection near 1.1120. However, a previous resistance area around 1.1105 sits before that target, so the trader does not assume the full projection will be reached.
Suppose the maximum planning loss is $8 and expected spread, commission and slippage total $1. That leaves $7 for price risk. The position is sized so that a 35-pip adverse move would lose no more than approximately $7 from price movement.
If the account's minimum position is too large to satisfy that limit, the trade is skipped.
After entry, price moves higher and pauses near the previous resistance zone around 1.1105. Whether the trader closes the entire position, takes partial profit or trails the stop depends on the management rule established beforehand.
The useful part of the example is the sequence of defined conditions: context, pattern structure, confirmation, invalidation, cost allowance, target reference and position size.
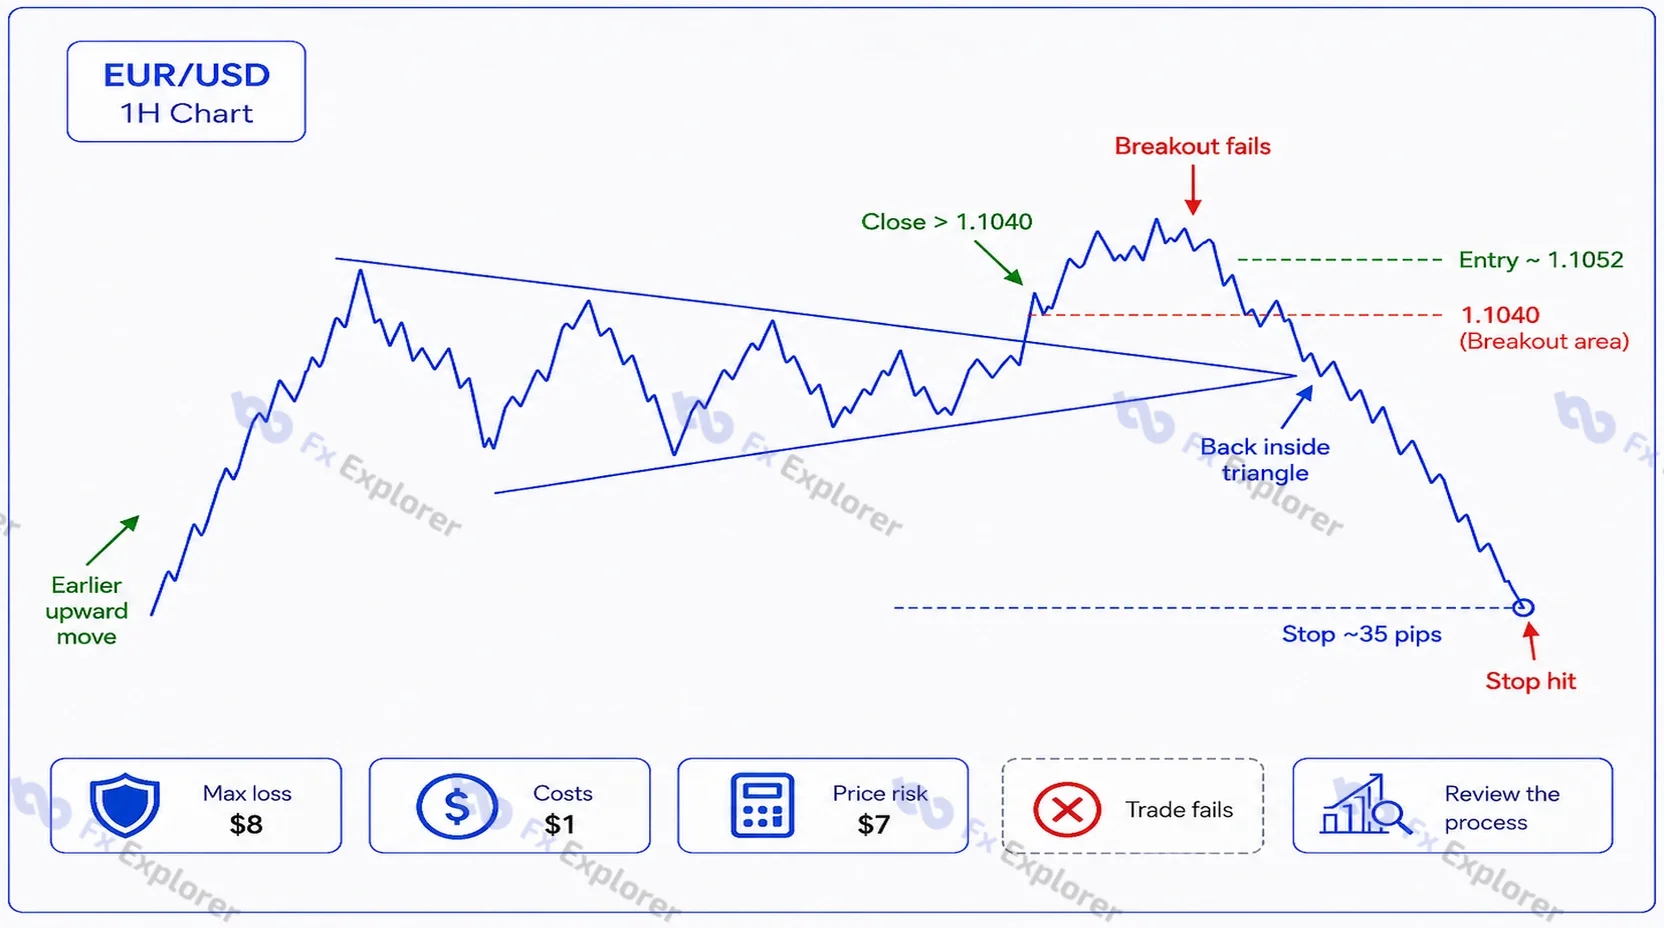
Failed Version of the Same Setup
Now use the same triangle and confirmation rule.
Price again closes above 1.1040, and the trader enters near 1.1052 with the same 35-pip structural stop.
This time, the breakout stalls. Price falls back through the breakout level and closes decisively inside the triangle. The invalidation rule is eventually triggered before the target is reached.
The trade closes for the planned loss plus actual execution costs.
The failure does not automatically mean the triangle was badly identified. A correctly recognized and properly confirmed pattern can still fail.
The review should distinguish ordinary pattern failure from process errors. Did the structure satisfy the written definition? Was the confirmation rule followed? Was the stop placed at the predefined invalidation level? Was position size calculated correctly? Were actual spread and slippage close to assumptions? Was an important event or unusual execution condition ignored?
If the rules were followed, the loss belongs to the method's expected distribution. Entering early, widening the stop or ignoring a known event would be a different issue.
How to Test Forex Chart Patterns Properly
Testing turns a visually attractive formation into a defined trading method. The objective is not to prove that a favorite pattern works, but to determine how a precise set of rules behaved under realistic conditions.
Define the Pattern Before Testing
The definition should specify the required prior trend, swing structure, boundary rules, tolerances and completion criteria.
For a double top, rules might define how close the two peaks must be, how much separation is required, what qualifies as the intervening low and whether confirmation requires an intrabar break or a closing break.
Without clear rules, hindsight becomes difficult to control. Successful examples are remembered as valid patterns while losing formations are dismissed as “not quite right.”
Use a Consistent Testing Workflow
- Define the pattern and required market context before examining the result.
- Specify confirmation, entry, invalidation, target and any maximum holding-period rule.
- Include realistic spread, commission and slippage assumptions.
- Test the same rules across a meaningful sample on the actual pair and timeframe.
- Separate materially different market regimes where appropriate.
- Keep failed breakouts and ambiguous examples in the sample when they meet the predefined rules.
- Measure expectancy and drawdown, then forward-test the unchanged rules before risking meaningful capital.
Include Real Trading Costs
A pattern can show favorable directional behavior yet produce poor trading results after spread, commission and slippage.
This matters particularly for small intraday formations. Backtests that use midpoint prices or assume perfect fills can materially overstate what was actually executable.
Test by Pair and Timeframe
Do not assume a pattern behaves identically on EUR/USD, GBP/JPY and USD/CHF.
Liquidity, volatility, session behavior and typical spread vary by pair. The same applies to timeframes. A formation that occurs frequently on five-minute data may have very different cost sensitivity and false-break behavior from a similar structure on four-hour charts.
Measure More Than Win Rate
Win rate alone does not determine whether a method is worthwhile. A strategy that wins 65% of the time can still lose money if the average loss is much larger than the average win.
Useful measurements include trade count, win rate, average win, average loss, expectancy, profit factor where useful, maximum drawdown, average holding time, failed-breakout frequency and the distribution of realized risk-to-reward outcomes.
The theoretical target is less important than what trades actually achieve over a meaningful sample.
Keep Pattern-Specific Records
A useful journal can record the pattern type, currency pair, timeframe, prior market context, breakout and confirmation method, entry, invalidation, target, actual trading costs, outcome and whether the setup became a failed breakout.
Over time, those records can answer questions generic articles cannot: whether a pattern behaves differently by session, whether waiting for a close improves results enough to justify later entries, whether retest entries are less frequent but more efficient, or whether one pair produces substantially more failed breakouts than another.
Common Forex Chart Pattern Mistakes
Most chart-pattern errors come from inconsistent interpretation and execution rather than failure to memorize enough formations.
Common mistakes include naming a pattern before it is complete, forcing trendlines through unsuitable pivots, ignoring the prior trend, confusing flags, pennants, triangles, wedges and channels, predicting breakout direction before the structure resolves and chasing price after a breakout has already travelled too far.
Other errors include assuming every breakout must retest, ignoring spread and slippage, placing a stop according to a preferred lot size rather than invalidation, treating a measured target as guaranteed, risking more because a pattern “looks strong,” or opening several correlated positions based on similar currency exposure.
Testing can introduce another layer of bias. Judging reliability from a handful of screenshots, excluding failed patterns from the sample or changing recognition rules after seeing the result can make a method appear more consistent than it really is.
When Not to Trade a Chart Pattern
Recognizing a pattern does not create an obligation to trade it.
Standing aside may be appropriate when the structure is unclear or incomplete, the boundaries must be forced, no defensible invalidation point can be identified, or the breakout has already moved so far that the remaining reward is poor relative to risk.
Execution can also make an otherwise valid pattern unsuitable. Unusually wide spreads, likely slippage, poor liquidity or a minimum position that exceeds the intended risk limit may be enough to reject the setup.
Major economic news and nearby higher-timeframe support or resistance deserve similar attention. A clean breakout with very little room before an important opposing level may not justify the risk simply because the pattern is recognizable.
Sometimes the most useful conclusion from chart-pattern analysis is that no acceptable trade exists.
Are Forex Chart Patterns Reliable?
No forex chart pattern has a universal reliability rate, and fixed accuracy percentages should not be applied across different pairs, timeframes and trading rules.
Research on technical patterns has found that objectively defined formations can contain information in some datasets, but statistical predictability does not automatically translate into profitable trading after execution costs.
Results depend on how the pattern is defined, which market and period are tested, how confirmation is handled, where entries and exits occur and what the trade costs to execute.
Claims that one formation is “80% accurate” or universally the “most profitable forex pattern” are therefore incomplete without a reproducible methodology.
Even a pattern with positive historical expectancy can experience failed breakouts, losing sequences and long periods of weak performance.
The practical question is not whether chart patterns work in the abstract. It is whether a precisely defined pattern, traded with consistent confirmation, realistic costs and controlled risk, has shown acceptable behavior in the environment where it will actually be used.
Conclusion
Forex chart patterns are most useful when they turn visual price behavior into a clear decision framework. Recognizing the shape is only the beginning. The trader still needs to understand the prior structure, judge whether the formation is clean and complete, define confirmation, identify invalidation, account for execution costs and size the position accordingly.
The same framework applies whether the chart shows a double top, flag, triangle, wedge or head-and-shoulders formation:
Patterns will fail. Measured targets will sometimes be missed, and apparently clean breakouts will reverse. The objective is not to eliminate that uncertainty, but to make each trade understandable, measurable and controllable before capital is exposed.
FAQ
What are the most common forex chart patterns?
What is the most reliable forex chart pattern?
Do forex chart patterns really work?
Which forex chart patterns signal reversals?
What timeframe is best for forex chart patterns?
How do you confirm a forex chart pattern?
Can a forex chart pattern fail after a breakout?
Which forex chart patterns are continuation patterns?
What is the difference between a chart pattern and a candlestick pattern?

Nella Spencer
Nella Spencer is a financial analyst and reviewer specializing in online brokers and trading platforms. Her work focuses on broker comparisons, pricing and fees, regulatory standards, and platform reliability. She helps readers understand complex financial services information through clear, structured, and practical analysis.